

Define the role before judging the sites
Start by stating what the location is expected to do. Is it meant to enter a new market, close a coverage gap, support an existing cluster, replace an underperforming store or test a new format? A site that is strong for one objective may be weak for another.
Translate that role into a short list of decision criteria. These might include:
- concentration of target customers;
- household income and life-stage fit;
- accessibility and relationship to major routes;
- nearby retail destinations and competitors;
- distance from and overlap with current stores;
- suitability for the intended format; and
- risks that still require on-site or commercial due diligence.
Set the criteria before the team becomes attached to a preferred address. How Area Profiling Supports Site Selection provides a useful foundation for this step.
Make the geographic comparison fair
The boundary around each site changes the answer. Comparing a wide radius around one location with a tightly drawn catchment around another will distort population, income, competition and retail totals.
Use the same boundary method where the sites serve a similar mission. If a different polygon is justified by road access, barriers or settlement shape, record that reasoning. The aim is not to force two markets into identical circles. It is to make deliberate, transparent choices so stakeholders can distinguish a real market difference from a measurement difference.
The article What Is Catchment Analysis? explains when a radius, travel-based view or bespoke polygon may be appropriate.
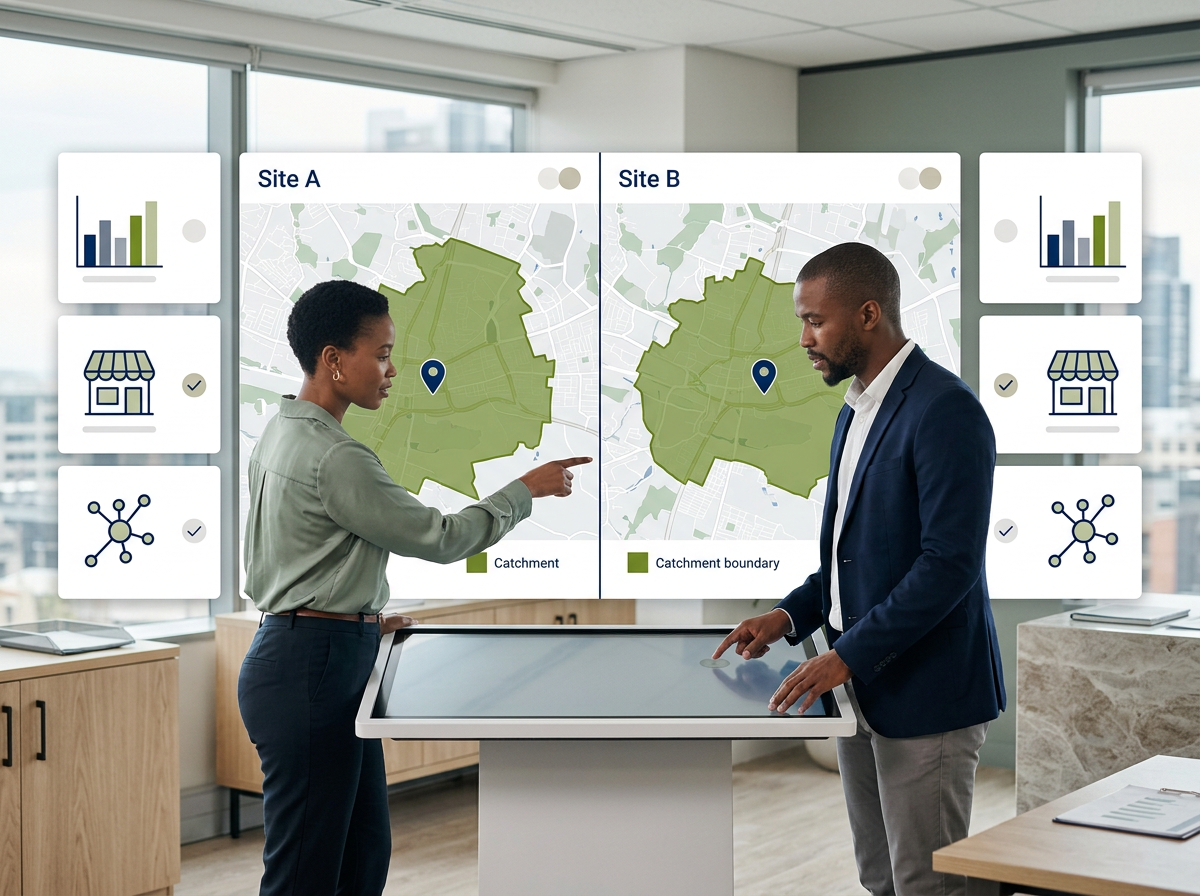
Create a balanced split-screen comparison in a LEO-inspired interface. Site A and Site B should use equally sized map panels, matching catchment boundaries and identical demographic, retail-context and network-fit cards. Use clear comparison ticks and neutral status indicators, with no winner and no invented values.
Compare the market in layers
LEO, Lightstone’s interactive geospatial platform, lets teams view candidate sites within the same South African retail and demographic context. Plot both locations, apply comparable study areas and assess each layer in turn: population distribution, income, age, employment, lifestyle segments, shopping centres, stores and the existing network.
Do not look only for the site with “more”. Look for the site with a better fit. A larger population may be less relevant to the brand. More surrounding retail may signal a proven destination or stronger competition. Proximity to an existing store may support operational efficiency or create cannibalisation risk.
The purpose of a site comparison is not to make every location look measurable. It is to expose the trade-offs clearly enough to make a confident choice.
Use a scorecard without hiding the judgement
A scorecard can keep the evaluation consistent, but it should not turn the decision into false precision. Assign an agreed importance to each criterion, record the evidence and explain the rating. A brief note such as “strong target-market fit, but access must be validated during peak traffic” is more useful than an unexplained total.
Review six lenses:
- Demand: Is there enough relevant market potential?
- Customer fit: Does the demographic and lifestyle profile suit the offer?
- Access: Can customers reach, see and use the location conveniently?
- Retail environment: Do nearby centres, competitors and complementary businesses strengthen or weaken the case?
- Network effect: Does the site add coverage or pull from current stores? Read What Is Retail Cannibalization and How Do You Spot It in Your Network?.
- Execution risk: Which property, operational or local assumptions remain untested?
The outcome may be a preferred site, a conditional recommendation or a decision that neither opportunity meets the threshold.
Give decision-makers the same evidence
Once the spatial analysis is complete, generate a LEO Market Report for each radius or polygon. The report brings the area map, demographics, household income, age, employment and nearby retail visibility into a consistent, business-ready format.
Using two reports with the same structure makes it easier for property committees and senior leaders to review the sites without switching between unrelated sources. Reports can be produced in minutes, while LEO remains available for deeper questions and alternative views.
Keep commercial terms and field observations alongside the location evidence. Rental, parking, visibility, access conditions and development timing still matter; the spatial comparison helps the team understand the market in which those commercial terms must work.
A practical comparison checklist
- Define the business role and success criteria first.
- Use comparable catchments and the same data measures.
- Judge customer and network fit, not simply the largest totals.
- Record trade-offs and outstanding assumptions beside each score.
- Use LEO to explore both locations and Market Reports to present them consistently.
- Keep on-site, property and commercial due diligence in the final decision.

Put your shortlisted locations on equal ground
Compare candidate markets in LEO, generate a Market Report for each option and contact the Lightstone Explore team if you want help structuring a repeatable location-assessment process.
The better location is the one with the stronger overall case
Choosing between two sites is rarely about one perfect indicator. A disciplined comparison reveals how demand, customer fit, access, retail context, network impact and commercial reality interact. When both options are evaluated through the same lens, teams can explain the decision, challenge assumptions and move forward with greater confidence. Before signing off the preferred site, apply the wider checks in What to Consider Before Opening a New Retail Location.