

Catchment analysis defined
A catchment is the geographic area from which a store, branch, shopping centre or service location is expected to attract customers. Catchment analysis defines that area and evaluates the people, market conditions and competing choices within it.
The terms “catchment area” and “trade area” are often used in similar ways. The important point is that the boundary represents an area of influence, not simply a distance measurement. It should be appropriate to the business format, customer mission and local geography.
A convenience retailer may depend on a relatively local market. A destination store may attract customers from further away. Two stores in the same category can also have different catchments because of brand strength, centre quality, road access or surrounding competition.
Four ways to define a catchment
There is no single boundary that suits every decision. Common approaches include:
- Radius: A circle around a location. It is quick, repeatable and useful for early screening, but it does not account for real routes or barriers.
- Travel-based area: A boundary informed by practical access or travel time. This can better reflect the way customers reach the site.
- Customer-derived area: A view built from known customer origins, where suitable internal information is available.
- Bespoke polygon: A manually defined shape that accounts for roads, settlements, barriers, developments or local knowledge.
The method should match the question and remain comparable across candidates. A radius may be sufficient to identify broad differences. A high-stakes site recommendation may need a more considered polygon and additional ground validation.
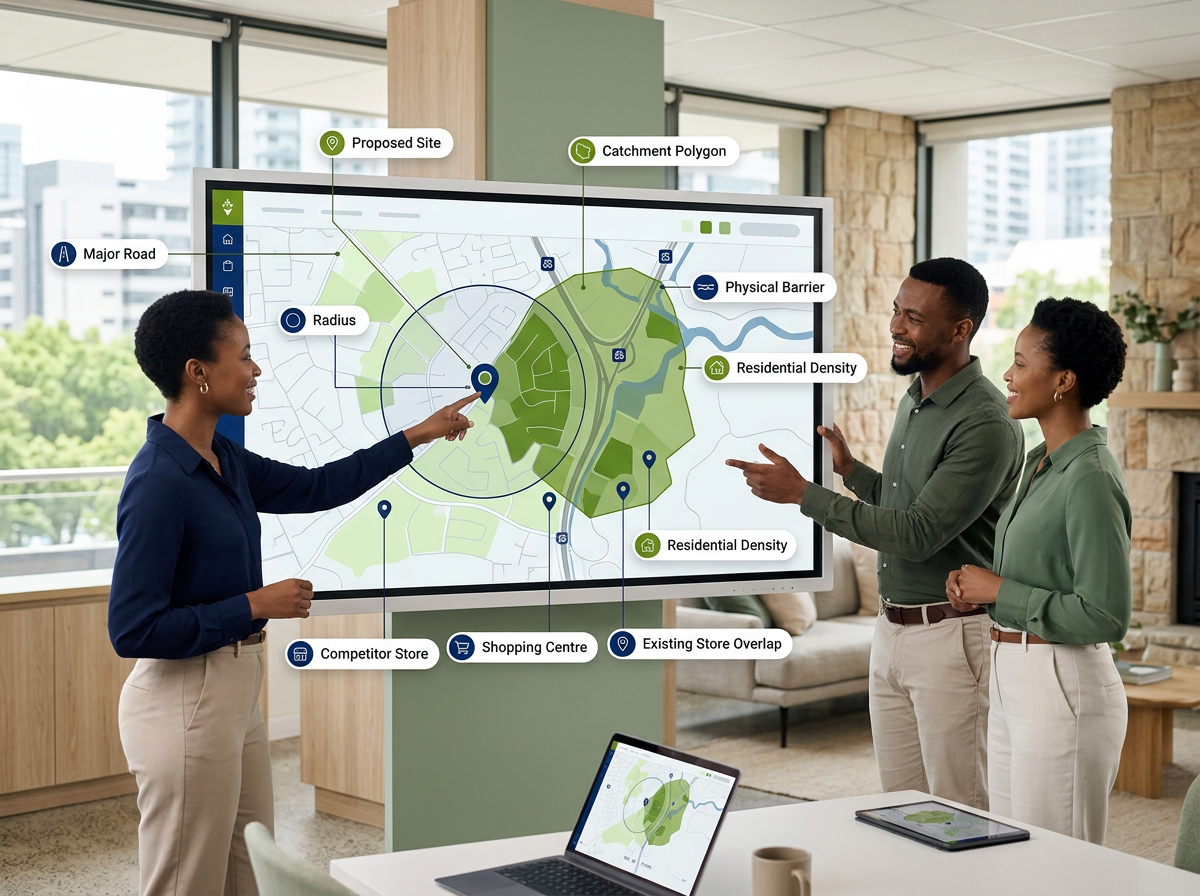
Create an annotated "anatomy of a catchment" map for a fictional South African retail site. Show a proposed-site pin, a radius outline, a more realistic irregular catchment polygon, a major road, a physical barrier, residential-density shading, competitor markers, one shopping centre and an existing-store overlap. Use callout labels to explain each element without adding numerical performance data.
The anatomy of a useful catchment view
The boundary is only the container. The analysis becomes useful when relevant layers are added. These can include population, household income, age, employment, lifestyle segments, residential density, nearby stores, shopping centres, competitors and existing network locations. Roads and physical barriers help explain why the market may not behave like a perfect circle.
A catchment is best treated as a decision model: useful when its assumptions are visible, relevant and tested against the way the local market actually works.
What the analysis should help you understand
A practical catchment review answers more than “How many people are nearby?” It should help the team assess:
- Market depth: the scale and distribution of the population within the area;
- Target-market fit: whether income, age, household, employment and lifestyle characteristics align with the offer;
- Retail context: the nearby centres, stores and competitors that may shape customer behaviour;
- Accessibility: the relationship between the location, roads, settlements and barriers;
- Network impact: whether the site adds new coverage or overlaps with current locations; and
- Comparative strength: how the market performs against another candidate or an agreed benchmark.
The demographic component is explored in What Demographic Data Should You Review Before Choosing a Site?. For a broader market view, see How Area Profiling Supports Site Selection.
Avoid the most common interpretation mistakes
First, do not assume that a larger catchment is automatically better. A smaller area with a strong concentration of target customers may suit the business more closely.
Second, do not read population or income without spatial context. People may be unevenly distributed, separated from the site or drawn towards another retail node.
Third, do not treat the boundary as permanent. Residential development, new roads, shopping centres and competitor activity can change the market. Use current information and revisit important assumptions.
Finally, do not confuse evidence with certainty. Catchment analysis should guide site visits, property due diligence, commercial modelling and local conversations. It is one connected part of a strong decision process.
How LEO supports catchment analysis
LEO is Lightstone’s interactive geospatial platform for exploring locations, markets, demographics and retail context. Teams can place a site within the wider South African market, examine relevant data layers and compare catchments in a clear map-based environment. The underlying location and demographic information is updated annually, and the retail landscape includes more than 1,900 malls and 60,000 stores.
After the team has explored the question, the LEO Market Report turns a selected radius or polygon into a business-ready output. It includes the area map, population and demographic insight, household income, age, employment and nearby retail visibility. Reports can be generated in minutes, making it easier to bring a consistent market view into a site or expansion discussion.
This combination matters: LEO supports investigation, while the Market Report helps communicate the chosen view. How Catchment Analysis Helps with Retail Expansion shows how the method works across a store network.
Catchment analysis in brief
- A catchment is the market area a location is expected to serve.
- Radius, travel-based, customer-derived and bespoke boundaries answer different questions.
- The boundary should reflect the format, customer mission and local geography.
- Demographics, retail context, accessibility and network overlap make the analysis meaningful.
- A catchment is a working model, not a guarantee of customer behaviour.
- LEO supports interactive exploration; the Market Report provides a structured output for decisions.

Explore the market around any location
Use LEO to examine catchments and market context, create a Market Report for a selected radius or polygon, or contact Lightstone Explore to discuss the questions your team needs to answer.
From a boundary on a map to a clearer business question
Catchment analysis gives location decisions a practical geographic frame. It helps teams define the market, test customer fit, understand nearby retail choices and consider how a site relates to the wider network. When its assumptions are transparent and the data is interpreted in context, the catchment becomes more than a shape: it becomes a credible foundation for deciding where to investigate, invest or grow. For the wider concept behind this approach, read What Is Location Intelligence and Why Does It Matter for Business?.