

Understand the real area a store can influence
A catchment is the geographic area from which a store is expected to attract customers. It may begin as a radius, but real customer behaviour is shaped by road networks, travel time, physical barriers, shopping-centre pull, public transport, competitors and the strength of the retail offer.
For expansion planning, the boundary should reflect the question. A quick radius can screen many markets. A bespoke polygon can represent a location affected by a highway, coastline, mountain, settlement pattern or uneven access. Existing customer or performance information can add another view where it is available.
The boundary is not a statement of certainty. It is a working model that allows the team to assess and compare the market consistently. See What Is Catchment Analysis? for a fuller explanation of the methods.
Find white space that contains the right customers
The strongest network gaps are not always the largest unserved areas. They are places where unmet demand, customer fit, access and commercial opportunity intersect.
Catchment analysis helps a retailer overlay the effective reach of current stores, then investigate markets beyond or between them. Demographic measures such as population, household income, age and employment help test whether the people in that area fit the offer. Retail context helps show whether the location sits near a relevant centre, complementary activity or competing destination.
This approach builds on the pillar guide How to Identify Gaps in Your Retail Network Before Your Competitors Do, moving from visible white space to an evidence-led opportunity shortlist.
See coverage, overlap and opportunity together
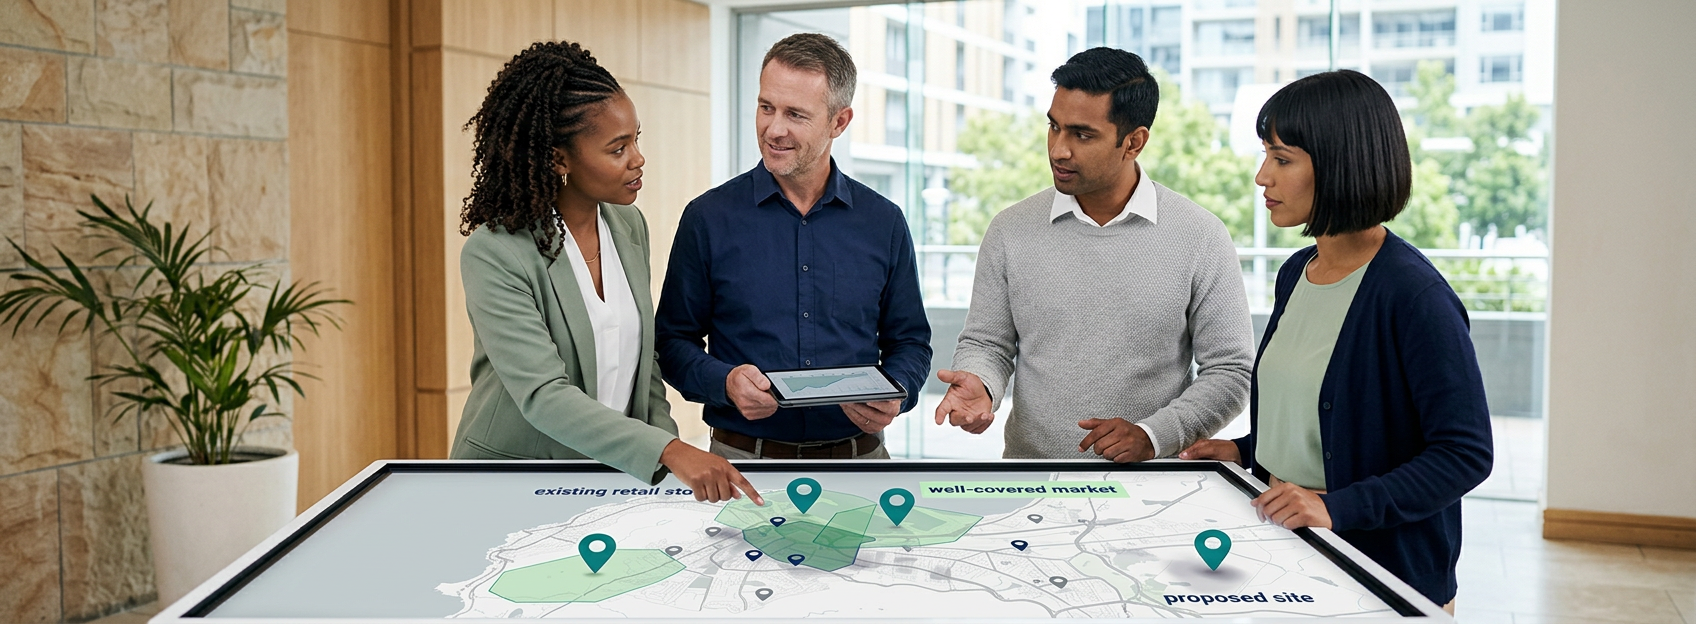
When store catchments are viewed across the whole network, expansion teams can distinguish three important patterns: well-served markets, overlapping areas and potential gaps. That view makes it easier to ask whether a new store adds useful reach, supports a cluster or risks taking demand from an existing location.
LEO, Lightstone’s interactive geospatial platform, gives teams a map-based environment for exploring these relationships. It combines demographic and location insight with a South African retail landscape of more than 1,900 malls and 60,000 stores, supported by annually updated data.
Retail expansion becomes more disciplined when every new site has a clear market to serve and a clear role in the wider network.
Use catchments to answer five expansion questions
For each potential market, assess:
- Who could the site serve? Review the population and target-customer profile within the proposed catchment.
- Is the market already covered? Compare the catchment with current stores and consider their effective reach.
- What else shapes customer choice? Map shopping centres, competitors and complementary retailers.
- Does the location fit the format? A neighbourhood, convenience or destination offer may require a different catchment and market depth.
- How does the opportunity rank? Apply the same criteria across markets so the portfolio can be prioritised.
Overlap is not automatically harmful. Stores may serve different routes, missions or customer groups. It does, however, require deliberate testing. What Is Retail Cannibalization and How Do You Spot It in Your Network? explores that risk in more detail.
Move from market exploration to expansion approval
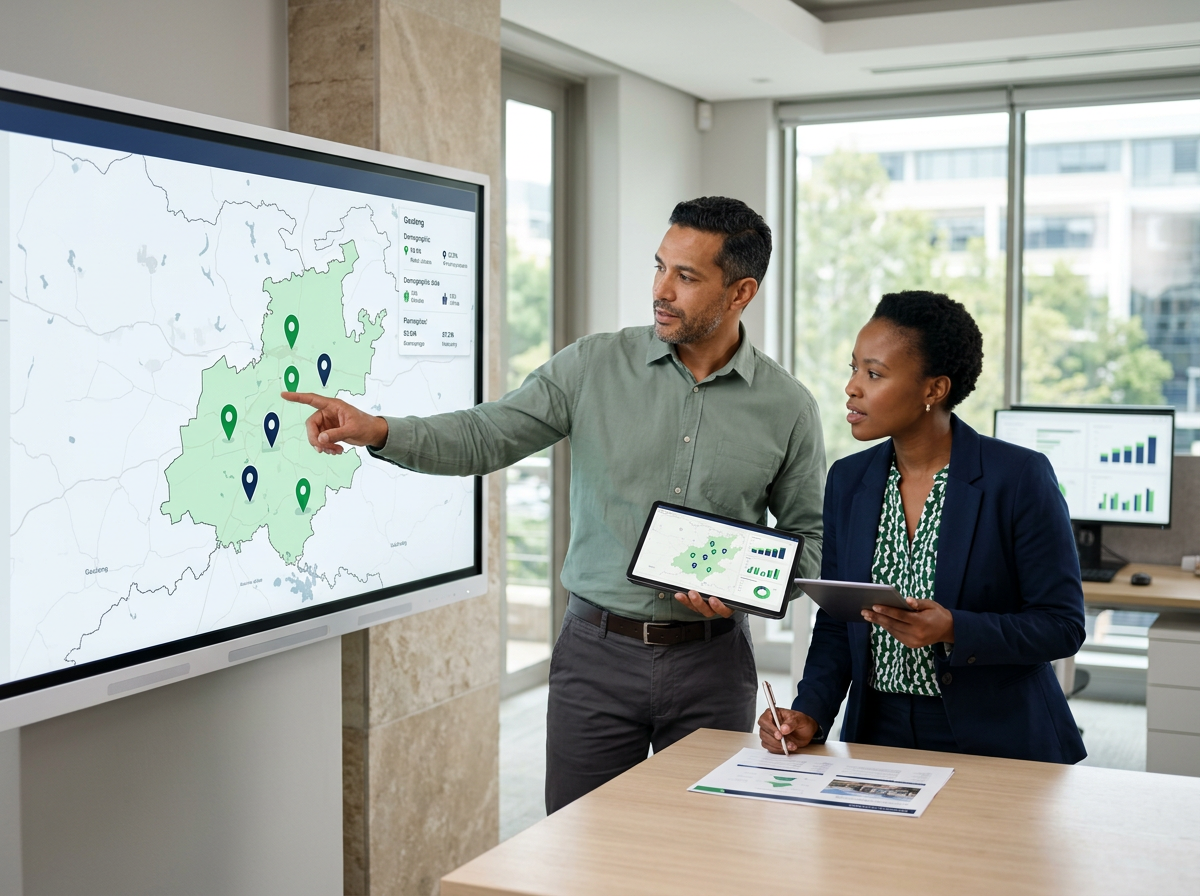
LEO supports the investigative stage: teams can adjust study areas, inspect demographic and retail layers, compare possible sites and place the opportunity within the current footprint. This helps analysts find the reason behind a promising map pattern.
The LEO Market Report supports the communication stage. Generated in minutes for a selected radius or polygon, it packages an area map, demographic and population insight, household income, age, employment and nearby retail visibility into a consistent output.
Together, the platform and report help expansion teams create a traceable funnel: broad markets, screened opportunities, comparable shortlists and decision-ready recommendations. Property terms, operational feasibility and fieldwork remain essential, but they are applied to opportunities with a clearer market case.
Catchment analysis can also inform difficult portfolio choices after expansion. When to Close, Relocate or Keep a Store: Using Data to Make the Call explains how the location lens supports those decisions.
What catchment analysis adds to expansion planning
- A realistic view of the market each store or proposed site can serve.
- Better identification of gaps that contain relevant customer demand.
- Clearer visibility of network coverage and possible overlap.
- Consistent comparison across towns, suburbs and candidate sites.
- Stronger alignment between market opportunity and store format.
- A shared evidence base for expansion, property and leadership teams.
Turn your expansion map into a prioritised plan
Explore markets, catchments and network coverage in LEO, create a business-ready Market Report for each shortlisted area, or talk to Lightstone Explore about your expansion questions and data needs.
Grow where the network and market support the move
Catchment analysis does not predict a store’s future. It gives retailers a more credible way to decide where to investigate, which customers a new location could serve and how the store may affect the wider footprint. By combining interactive analysis in LEO with consistent Market Reports, expansion teams can prioritise opportunities, surface risks and present recommendations that the business can examine and defend.