

GIS works with layers, areas and relationships
At its simplest, GIS combines a base map with layers of information. One layer might show existing stores, another shopping centres, another demographic characteristics and another the company’s own performance data. Because each record has a geographic reference, the layers can be viewed and queried together.
Three capabilities make this useful for business planning:
Visualisation reveals clusters, gaps and spatial patterns. Area analysis allows users to define a radius, polygon or other geography and summarise the data inside it. Relationship analysis helps teams consider proximity, overlap, access and the context around a location.
These capabilities turn a map from an illustration into a working analytical environment. A team can ask not only where a proposed store is, but which customers and competitors sit around it, how that market compares with another, and whether the site improves overall network coverage.
How Map-Based Insight Improves Business Planning looks at how this shared geographic view supports planning across functions.
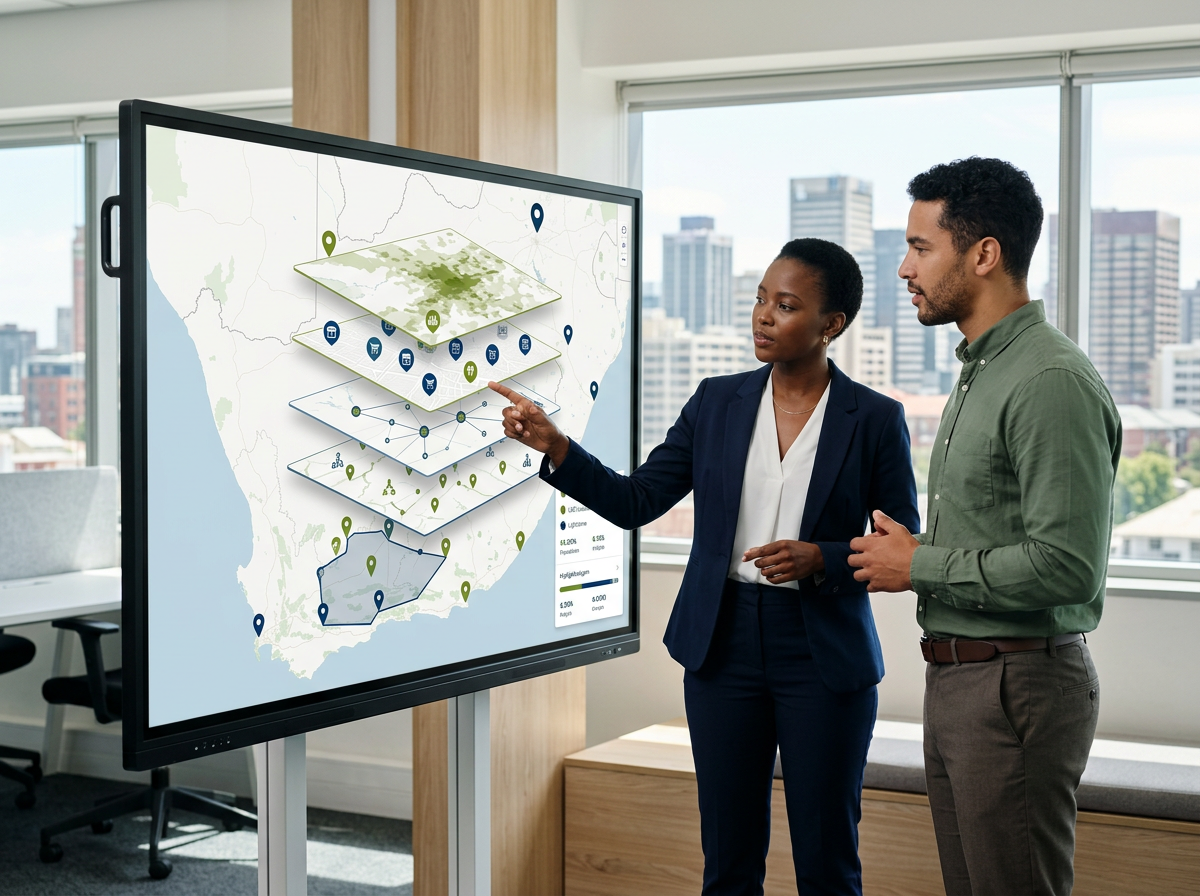
An exploded-layer diagram above a South African city map. Show five aligned layers labelled "Base geography", "Demographics", "Retail landscape", "Existing network" and "Internal business data", combining into a final analysis map with one selected catchment polygon. Keep the style professional and data-led.
Layer the evidence around the decision
Useful GIS analysis is selective. Start with the commercial question and choose the layers that can answer it. A site-selection study may require target demographics, existing-store catchments, competitors and retail destinations. A network review may place more emphasis on internal performance, coverage and possible overlap.
Each layer needs a clear definition, geographic scale and update date. Users should understand what the data can support and where interpretation is required. More layers do not automatically create more insight; irrelevant or inconsistent inputs can distract from the decision.
Compare catchments instead of relying on addresses
An address identifies a point; a catchment describes the market the location may serve. GIS allows teams to draw an initial radius or a custom area that reflects roads, barriers, destinations and the purpose of the site. They can then query the people, households, retail activity and other relevant conditions inside it.
Using the same method across candidate sites creates a fairer comparison. Teams can see whether a larger population also contains the right customer profile, whether apparent demand is already served by an existing branch, or whether a location’s accessibility extends its practical reach.
Catchments remain planning models, not guarantees of behaviour. They should be tested with internal customer evidence, field observation and operational knowledge where available. GIS makes the assumption explicit and adjustable, which is more useful than leaving the trade area implied. Read How Catchment Analysis Helps with Retail Expansion for a fuller expansion workflow.
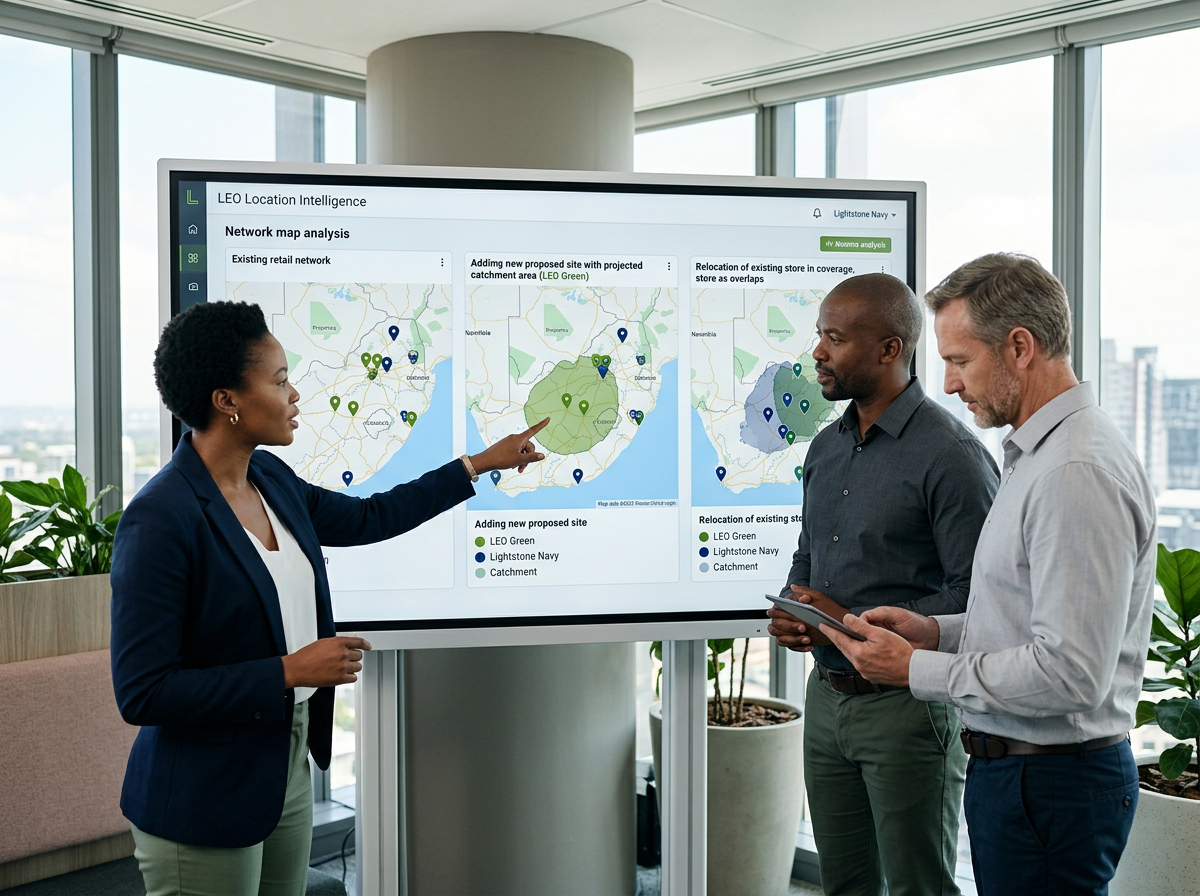
A three-scenario network map labelled "Current network", "Add proposed site" and "Relocate existing store". Use identical geography in each panel, with simple catchment shapes that show changes in coverage and overlap. Add a small note that scenarios support comparison and are not sales forecasts.
Test network scenarios before making physical changes
Because GIS shows multiple locations together, teams can evaluate how a decision affects the whole footprint. They can model a proposed store, a relocation or a closure and examine the resulting coverage and overlap. A candidate that looks attractive on its own may add little new reach; another may connect the network to a distinct customer market.
GIS also supports monitoring. Priority and emerging markets can remain mapped with the factors that make them relevant. When new property, competitor or development information appears, the team can return to the same spatial context instead of rebuilding the question from scratch.
GIS does not decide where a business should invest. It makes the geographic assumptions behind that decision visible and testable.
Move from specialist mapping to everyday location intelligence
Traditional GIS can involve specialist tools and technical workflows. Business-facing location intelligence makes core geographic analysis accessible to the property, retail-planning, research and strategy teams that use it regularly. The important principles remain: accurate location, relevant layers, transparent areas and careful interpretation.
LEO is Lightstone’s interactive geospatial platform for these South African business workflows. It combines map-based visualisation and querying with annually updated demographic and location data, a retail landscape of more than 1,900 malls and 60,000 stores, 19 lifestyle segments and over 100,000 enumerated areas. Teams can also visualise their internal data alongside this context.
After users explore and compare areas in LEO, the Market Report provides a business-ready output. Reports can be generated in minutes for a radius or custom polygon and include map context, demographic indicators, income, employment and surrounding retail information.
Where GIS improves the decision process
- It connects separate datasets through their geographic location.
- It reveals patterns that are difficult to see in tables.
- It defines the market around a site rather than stopping at the address.
- It supports consistent comparisons between catchments and candidates.
- It shows network coverage and overlap across multiple locations.
- It makes scenarios and assumptions visible before teams commit resources.
- It gives business users a common spatial view for discussion.

Apply GIS to a location question your team already has
Choose a current site comparison, catchment question or network scenario and explore it in LEO. The clearest way to understand the value of GIS is to see how your own locations and data relate to the surrounding market.
Talk to the Lightstone Explore team about your use case and the business-ready Market Report your stakeholders need at the end of the analysis.
Make geography part of the evidence
GIS helps businesses make smarter location decisions by organising relevant facts around place. It allows teams to see patterns, define markets, compare alternatives and test changes to a network while the options are still flexible.
The technology is most valuable when paired with credible data and commercial experience. Together, they turn “where?” from a point on a map into a structured question the business can answer with greater confidence.