

A map connects datasets through a common question: where?
Businesses collect information in different systems: store results, customer records, property opportunities, competitor lists, demographic profiles and development plans. Location provides a common reference that allows these inputs to be viewed together.
Once stores and other records are accurately placed, teams can examine relationships that are difficult to detect in tables. They can see clusters and gaps, define areas around a site, compare markets and identify where an internal trend intersects with an external condition.
This is particularly valuable in South Africa, where adjacent areas can differ materially and broad regional averages may conceal local realities. A map lets teams move between national network patterns and the detailed context around a particular location. It keeps the broader strategy and the local decision connected.
For the underlying concept, read What Is Location Intelligence and Why Does It Matter for Business?.
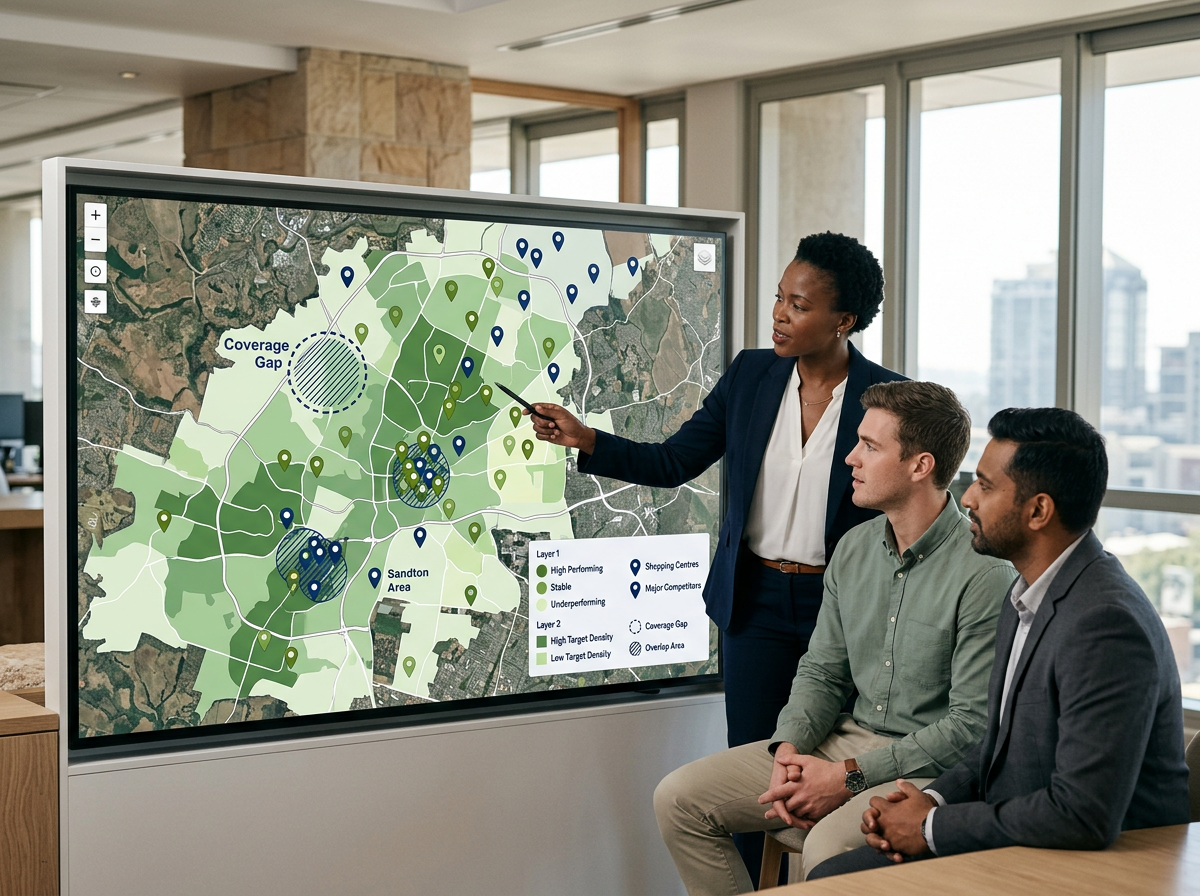
A professional LEO-style planning map of a South African metropolitan area with three purposeful layers: colour-coded store performance categories, shaded target-customer concentration and nearby shopping-centre or competitor markers. Include a compact legend and two annotated patterns: a coverage gap and an overlap area. Do not show invented monetary values.
See patterns before choosing an explanation
A map encourages better questions. Why do several strong stores align with a particular customer profile? Is a quiet territory genuinely underserved, or does it lack sufficient demand? Does a sales decline follow a change in local competition? Are service requests concentrated beyond the current footprint?
The first visual pattern is a starting point, not proof. Teams should test it against relevant data and operational knowledge. For example, a group of weak stores may share a market condition, but it may also share a store format or management issue. Map-based planning is strongest when geography is used to form and examine hypotheses rather than to produce a convenient story.
Layering should stay purposeful. Begin with the decision, add only the information that helps answer it, and record the definitions and time periods used. A crowded map can obscure the same patterns it is meant to reveal.
Improve planning across teams, not only in the property function
Different teams can use the same geographic foundation for different decisions.
Property and expansion teams can screen markets and compare sites. Network teams can assess coverage and possible cannibalisation. Marketing teams can understand where priority customers are concentrated. Operations teams can review service reach and local constraints. Strategy leaders can compare geographic scenarios and see where plans depend on the same markets or assets.
This shared view reduces the risk of each function using a different definition of an area. A suburb name, sales territory and customer catchment may refer to three different geographies. Drawing the relevant radius or custom polygon makes the planning unit explicit. It also creates a record that can be reused when the opportunity returns to committee.
The value is not merely visual. Teams can query the data inside an area, compare areas using consistent measures and relate the result to the network. From Map to Decision: How Location Intelligence Supports Retail Recommendations explains how to carry that analysis into a defensible recommendation.
A useful business map does more than show where things are. It reveals which facts belong in the same decision.
Use maps to test scenarios before committing resources
Planning often involves alternatives rather than a single answer. What happens to coverage if a store closes? Which customer markets become accessible if a branch relocates? How does a proposed site change the overlap between existing locations? Which areas should remain on a monitoring list?
Map-based analysis allows teams to define and compare these scenarios before action. Each option can be assessed against customer fit, catchment, surrounding retail, network impact and other relevant criteria. The assumptions remain visible, which helps decision-makers challenge the right part of the case.
LEO, Lightstone’s interactive geospatial platform, is designed for this work. Teams can explore South African demographic and location data, review a mapped landscape of more than 1,900 malls and 60,000 stores, use 19 lifestyle segments, and bring their own internal datasets onto the map. The data is updated annually, giving regular planning reviews a consistent local foundation.
Principles for useful map-based planning
- Start with a commercial question, not with every available layer.
- Use location to connect internal results with external market context.
- Move between network patterns and site-level detail.
- Treat visual patterns as hypotheses that need testing.
- Define catchments, territories and comparison areas explicitly.
- Give cross-functional teams one shared geographic view.
- Compare scenarios before capital, leases or operational changes are committed.

Move from the working map to a business-ready output
LEO gives analysts and planning teams the interactive environment to explore, query and compare locations. When the findings need to move into a property committee, client discussion or strategy review, a Market Report can be generated in minutes for a chosen radius or polygon, with map context, demographic indicators and nearby retail in a structured format.
Talk to the Lightstone Explore team about the planning questions and internal datasets you would like to bring into one location view.
Make place part of the planning conversation
Business plans become clearer when teams can see how customers, assets, competitors and opportunities relate in space. Map-based insight exposes connections that tables often separate and creates a common language for people with different roles.
Its real value comes from disciplined use: define the question, select credible layers, test the pattern and communicate the result. Done well, the map becomes more than a visual. It becomes a practical bridge between business data and action.