

A recommendation must answer more than “where?”
Retail decisions are rarely about coordinates alone. The same property can look very different once the surrounding market is considered. A visible site may sit outside the natural path of target customers. A smaller centre may serve a well-matched catchment. An apparently open territory may already be influenced by a nearby store or competitor.
A useful retail recommendation therefore needs to answer five connected questions:
- Where is the opportunity? Define the site, radius, catchment or custom area being assessed.
- Who is in the market? Review population, age, household income, employment and relevant lifestyle characteristics.
- What is already there? Understand the nearby store network, shopping centres, competitors and complementary retail.
- How does it compare? Apply the same criteria to alternative sites and relevant existing stores.
- What should happen next? Translate the evidence into a practical recommendation, including important conditions or remaining checks.
This disciplined approach also helps teams distinguish a genuine gap from a blank space on a map. For a deeper network view, read How to identify gaps in your retail network before your competitors do.

A clean horizontal decision journey on a South African urban map showing four labelled stages flowing left to right: Site, Market layers, Comparison and Recommendation, with restrained icons for demographics, stores, shopping centres and an internal dataset, ending in a concise recommendation card in navy, white and turquoise.
Build the evidence in layers
Location intelligence works because different layers answer different parts of the business question. Begin with the site and an appropriate study area. Add the organisation’s current locations, then demographic and customer-fit indicators, nearby retail and any internal performance or customer data that can be mapped responsibly.
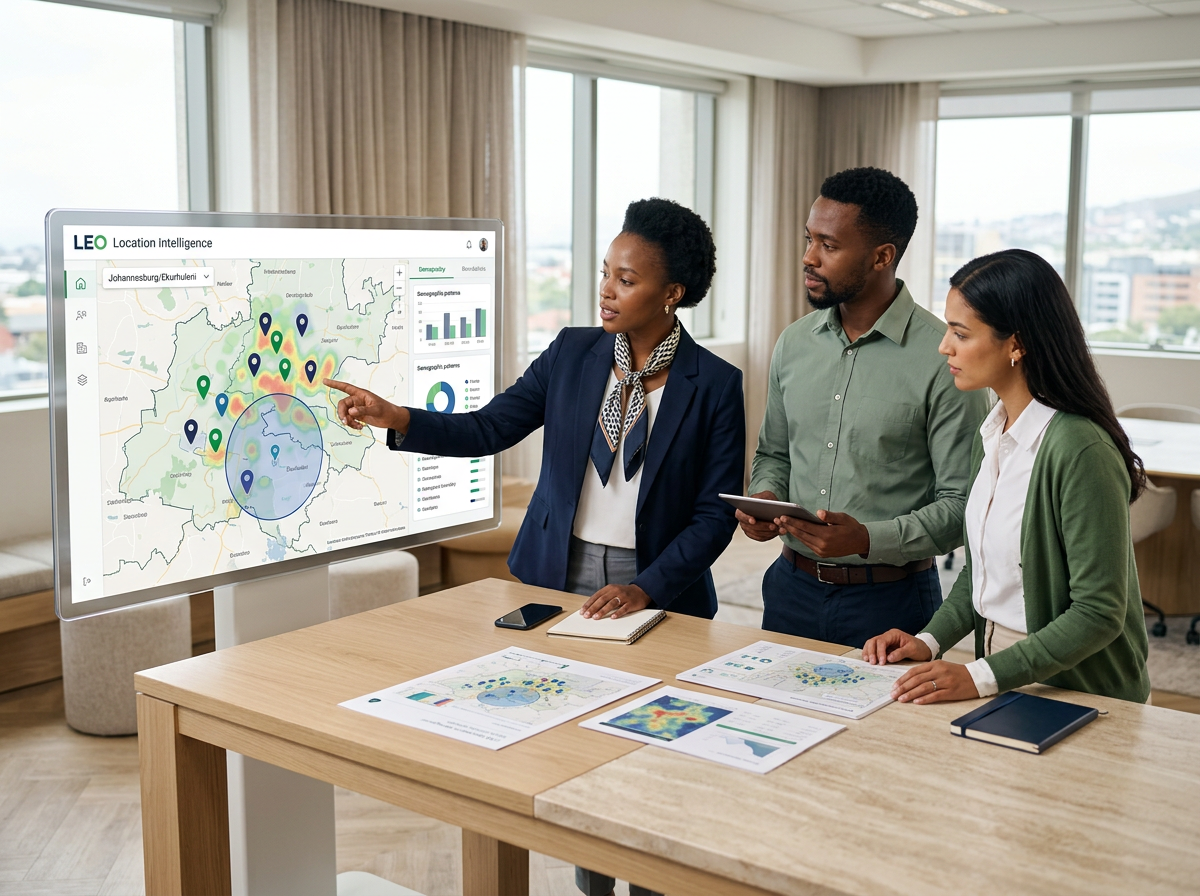
In LEO, Lightstone Explore Online, teams can explore these layers interactively, query areas and compare patterns rather than working from disconnected spreadsheets and static maps. LEO is grounded in more than 20 years of South African retail expertise, with demographic and location data updated annually. Its national context includes more than 1,900 malls, over 60,000 stores, 19 lifestyle segments and more than 100,000 enumerated areas.
Those figures are valuable because they provide context, not because volume alone guarantees a good decision. The recommendation still depends on selecting relevant indicators and interpreting them against the retailer’s format, customer and network strategy. What makes location data credible and why it matters for your business explains how to assess that foundation.
Compare consistently before you recommend
Comparisons become unreliable when every site is assessed differently. One opportunity may be described using population, another using nearby retail and a third using a landlord’s footfall estimate. Even when each observation is valid, the decision is difficult to defend because the evidence is not comparable.
Create a repeatable scorecard before reviewing the candidates. The measures should reflect the actual concept and may include target-market presence, income profile, catchment reach, accessibility, surrounding retail, competitive intensity and overlap with the current network. Keep the raw indicators visible alongside any score so that decision-makers can understand what is driving the result.
The aim is not to force a complex decision into a single number. It is to expose trade-offs. Site A may offer a larger market but weaker customer fit; Site B may have a smaller catchment but better retail context. A structured comparison makes that difference clear. See How to compare two business locations more effectively for a focused method.
“A useful map does not make the decision for you. It makes the evidence, trade-offs and reasoning easier for everyone to see.”
That visibility matters when a recommendation moves from an analyst to property, operations, finance and an investment committee. Each audience needs the same evidence at a different level of detail.
Turn analysis into an output built for action
Interactive analysis and decision communication are different jobs. LEO supports the exploration: changing the study area, switching layers on and off, comparing options and asking follow-up questions. Once the team has reached a view, the LEO Market Report turns the selected radius or polygon into a business-ready output in minutes.
The report brings together area maps, demographic and population insight, household-income ranges, age and employment profiles, nearby retail visibility and shopping-centre context. That structure gives stakeholders a consistent record of the market considered at the time of the recommendation.
A strong recommendation should still state its limits. Note where a lease review, site visit, operational assessment or additional internal analysis is required. Location intelligence strengthens professional judgement; it does not replace the commercial, property and operational checks that turn an attractive market into a viable store.
Key takeaways
- Start with a clear decision question, not simply an available site.
- Combine geographic, demographic, retail, catchment and relevant internal data.
- Use the same decision criteria across every option.
- Keep trade-offs visible instead of hiding them in one score.
- Use LEO for interactive analysis and the Market Report for a structured, shareable output.
- Record assumptions and follow-up checks so the recommendation remains credible.
Make your next retail recommendation easier to defend
Explore the market interactively in LEO, then generate a Market Report for the radius or polygon you need to present. If your team is comparing sites, reviewing a network or building an expansion case, talk to the Lightstone Explore team about the right workflow and data for your decision.
From a place on the map to a recommendation with purpose
Location intelligence closes the gap between seeing a location and understanding it. By organising the market around a site, applying consistent comparisons and producing a clear output, it helps retail teams make recommendations that are faster to examine, easier to communicate and better grounded in evidence.
The result is not certainty. It is something more useful: a transparent decision process that shows why an opportunity deserves the next conversation.