
Cannibalisation is a network effect, not simply a nearby store
Some overlap is normal, particularly in dense urban markets or networks designed for convenience. The question is whether the second location creates incremental reach and value after the transfer of existing trade is considered.
Three situations may look similar on a map but mean different things:
- Complementary coverage: Nearby stores serve distinct customer pockets, travel routes or shopping missions.
- Managed overlap: Some trade moves, but the new location adds sufficient customers, capacity or strategic coverage.
- Harmful cannibalisation: A large share of the new store’s activity appears to come from existing locations, weakening network contribution without enough compensating benefit.
This is why store-level performance alone can mislead. A new branch may meet its target while a nearby store absorbs the decline. Network performance and customer reach need to be assessed together.
For the broader portfolio context, read How South African retailers are using data to future-proof their store networks.
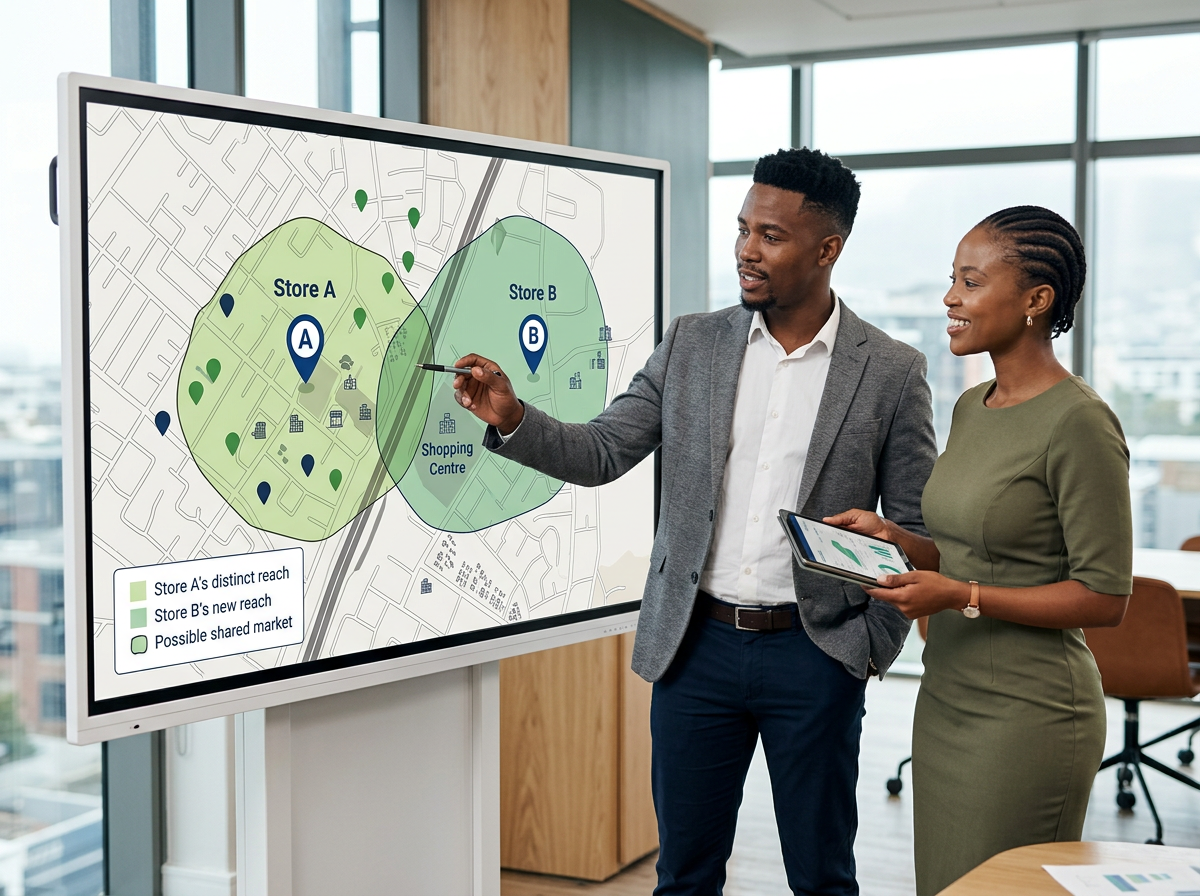
Draw two irregular retail catchments around Store A and Store B on a simplified South African urban map. Use three clearly labelled zones: “Store A’s distinct reach”, “Possible shared market” and “Store B’s new reach”. Add a road barrier and a shopping centre to show why catchments are not perfect circles. Avoid sales arrows that imply a confirmed transfer.
Map the likely transfer before looking for a cause
Begin by plotting the stores, their realistic catchments and any available customer-origin information. Look beyond straight-line distance. Roads, physical barriers, public transport, shopping centres, store format and local travel patterns can pull customers in different directions.
LEO, Lightstone Explore Online, lets teams view their own network alongside South African demographic, retail and location layers. The platform’s annually updated data and national context — including more than 1,900 malls and over 60,000 stores — help explain what sits between two locations and whether they plausibly serve the same market.
Define a shared overlap area, then compare it with the areas that are unique to each store. If internal data is available, assess whether customer origins or performance changes are concentrated in the shared zone. If not, treat the mapped overlap as a hypothesis for further research, not a measured transfer.
Look for a pattern of evidence, not one signal
No single metric establishes cannibalisation. Build a timeline around the opening, relocation or format change and look for several signals that point in the same direction:
- a sustained change at nearby stores after the new location opened;
- customer or transaction shifts concentrated in the likely overlap area;
- similar product or mission patterns moving between the locations;
- weaker combined network growth than the added site was expected to produce;
- reduced reach in neither market despite the additional operating point; and
- local team observations that match the mapped pattern.
Then test alternative explanations. A competitor may have opened, a centre may be under construction, stock availability may have changed, or wider economic conditions may be affecting the area. Compare relevant periods and, where possible, similar stores that were not exposed to the same network change.
The aim is not a perfect attribution model. It is a balanced view of whether the geographic and performance evidence is strong enough to influence a decision.
Overlap tells you where to investigate. Cannibalisation is the business effect you still need to demonstrate.
Keeping those ideas separate protects teams from closing a useful location simply because two catchments intersect — or approving another site without considering its impact on the portfolio.
Decide at network level
Once the issue is understood, consider the role and economics of both stores. Options may include keeping both, changing formats or ranges, adjusting territories, relocating one branch, renegotiating property exposure or closing a location. The answer depends on contribution, strategic coverage, customer access and operational realities, not geography alone.
The LEO Market Report supports this review by turning a selected radius or polygon into a business-ready area profile in minutes. It combines the map with population, household-income, age, employment, nearby-retail and shopping-centre context. Teams can generate consistent reports for the shared market and alternative locations, then combine them with internal sales, margin, cost and lease analysis.
When to close, relocate or keep a store: using data to make the call provides a decision framework for that next step. If the concern is future coverage rather than current overlap, use How to identify gaps in your retail network before your competitors do.
Key takeaways
- A nearby store or overlapping catchment does not, on its own, prove cannibalisation.
- Distinguish complementary coverage, managed overlap and harmful trade transfer.
- Review combined network performance, not only the new store’s result.
- Map realistic catchments and use customer-origin data where it is appropriate and available.
- Test competitor, operational and market explanations before attributing a decline.
- Evaluate keep, format, relocation and closure choices at network level.

Investigate overlap with the full market in view
Use LEO to map your footprint, investigate catchment relationships and place internal signals in South African market context. Generate a consistent Market Report for the areas you need to compare, then talk to the Lightstone Explore team about a network-overlap review suited to your business.
Diagnose the transfer before choosing the response
Retail cannibalisation is not a map pattern; it is a network outcome. Geography helps define where trade could move, while customer and performance evidence helps determine whether it did and whether the transfer matters.
By treating overlap as a question, testing multiple explanations and evaluating value across the whole footprint, retailers can respond with more precision — protecting useful coverage while addressing duplication that no longer serves the network.