

Move from a store list to a living network view
Store performance is often reviewed one branch at a time. That is useful for operations, but it can hide the geographic relationships that shape the whole network.
When every location is plotted together, teams can ask broader questions:
- Which markets sit outside the effective reach of the current footprint?
- Where are neighbouring stores likely to influence the same customers?
- Which locations appear to serve unusually large or changing catchments?
- Does the network still align with the target customer?
- Where have retail destinations or competitor clusters changed?
- Could a different store format serve an area more appropriately?
This view reframes growth. The objective is not simply more pins on the map; it is stronger coverage and a clearer role for each location. How to identify gaps in your retail network before your competitors do shows how to distinguish genuine unmet opportunity from empty map space.
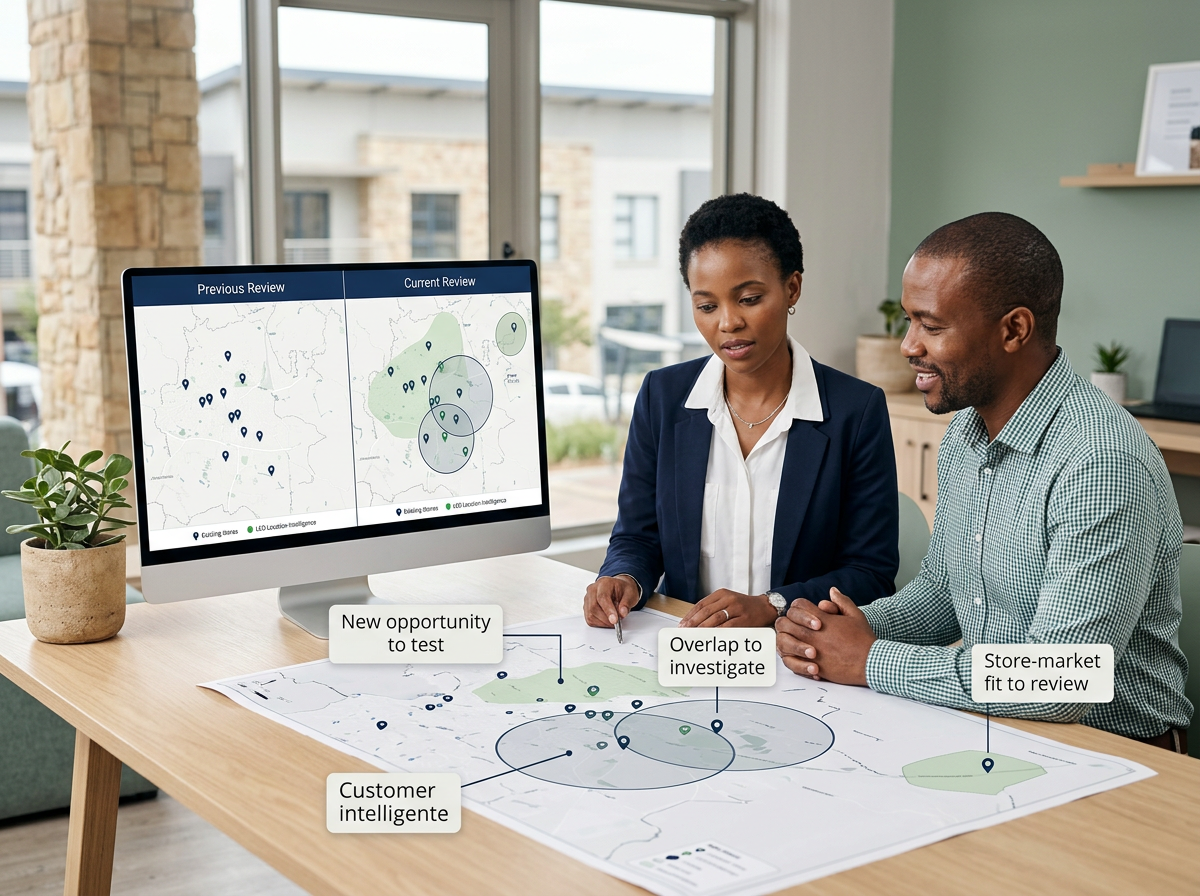
Create a South African retail-network map shown at two moments: “Previous review” and “Current review”. Use the same store pins in both. On the current view, show one emerging residential/customer cluster, one overlapping pair of catchments and one market beyond current coverage. Add three neutral callouts: “New opportunity to test”, “Overlap to investigate” and “Store-market fit to review”.
Connect market change to your own performance
External data can show how an area is changing. Internal data shows how the business is responding. Mapping the two together helps teams move from observation to diagnosis.
LEO, Lightstone Explore Online, is an interactive geospatial platform that combines South African demographic, retail and location context with a team’s own mapped data. Its demographic and location data is updated annually, while its national retail foundation includes more than 1,900 malls and over 60,000 stores. Nineteen lifestyle segments and more than 100,000 enumerated areas add a detailed market lens, backed by more than 20 years of South African retail expertise.
A retailer might overlay stores with performance bands, customer origins or territories, then examine the surrounding population, lifestyle and retail context. The purpose is not to assume a demographic change caused a performance result. It is to identify a pattern worth testing — such as a store losing relevance to its surrounding market or an underserved customer pocket appearing between existing catchments.
Build a regular network-review rhythm
A network review is most useful when it is part of planning, not only a response to weak sales or a property deadline. A practical rhythm can operate at three levels.
At a strategic level, review the full footprint against market and demographic change. This identifies regions and customer segments that deserve attention. At a portfolio level, examine clusters of stores for gaps, overlap, format opportunities and competitor movement. At a site level, investigate a specific branch or candidate with a carefully defined catchment and business-specific data.
Use consistent measures across review periods. If catchment definitions or performance bands change, record the change so that apparent movement is not mistaken for a market trend. Keep local operations and property teams involved; they can explain roadworks, lease conditions, centre changes and other realities that are not obvious in the data.
This rhythm helps teams act earlier. What is retail cannibalization and how do you spot it in your network? provides a focused method for investigating one common network risk.
A future-ready network is not a finished footprint. It is a footprint the business can question, compare and adapt as the market changes.
That adaptability matters because the right response is not always a new full-size store. The evidence may support a relocation, a smaller format, a different territory, an investment in an existing branch or no physical expansion at all.
Turn the network signal into a decision-ready case
A map can identify where to investigate, but decision-makers need a clear view of the selected market. The LEO Market Report can be generated in minutes for a radius or custom polygon, combining geographic context with population, household-income, age, employment, nearby-retail and shopping-centre insight.
This structured output is useful when teams need to compare a possible growth area with an existing store, document the market around a relocation option or bring a consistent evidence pack into a portfolio discussion. It should sit alongside internal performance, financial, lease and operational analysis.
For expansion, the key question is not only whether an area is attractive. It is whether the move adds reach, strengthens the network and fits the customer without creating avoidable overlap. How catchment analysis helps with retail expansion helps answer that coverage question.
Key takeaways
- Review stores as an interconnected footprint, not only as individual branches.
- Map internal performance with external demographic, location and retail context.
- Treat patterns as questions to test, not proof of cause.
- Review the network regularly at strategic, portfolio and site levels.
- Consider relocation, format and investment options alongside new-store growth.
- Use LEO for ongoing exploration and the Market Report for comparable decision packs.

See where your network may need to move next
Bring your footprint and market context together in LEO, then generate a business-ready Market Report for the areas that deserve a closer look. Talk to the Lightstone Explore team about gap analysis, network overlap, customer fit and a repeatable review process for your portfolio.
Future-proofing starts with a network you can see clearly
Retail networks will always face change. The advantage comes from noticing where the footprint and market are moving apart, then evaluating the response with evidence.
By combining an annually refreshed South African market view with its own performance knowledge, a retailer can identify emerging opportunities, investigate risk and make network choices with greater clarity. That is not a perfect forecast. It is a more resilient way to plan.