

Market size and market fit are not the same thing
A large local population can be encouraging, but it does not automatically represent a strong addressable market. A retailer needs enough people who are likely to value its particular range, price point, format and convenience proposition.
Demographic analysis helps teams move from “How many people are here?” to more useful questions:
- Which age groups are most prominent?
- What household-income ranges are represented?
- What does employment status suggest about the local market?
- How are households and lifestyle groups distributed across the area?
- Does the profile resemble markets around relevant, successful stores?
- Does the profile change materially within different parts of the catchment?
These questions prevent population from becoming a shortcut for demand. They also help explain why a location that looks modest at a municipal or suburb level may contain a relevant customer pocket. For a practical pre-site checklist, see What demographic data should you review before choosing a site?
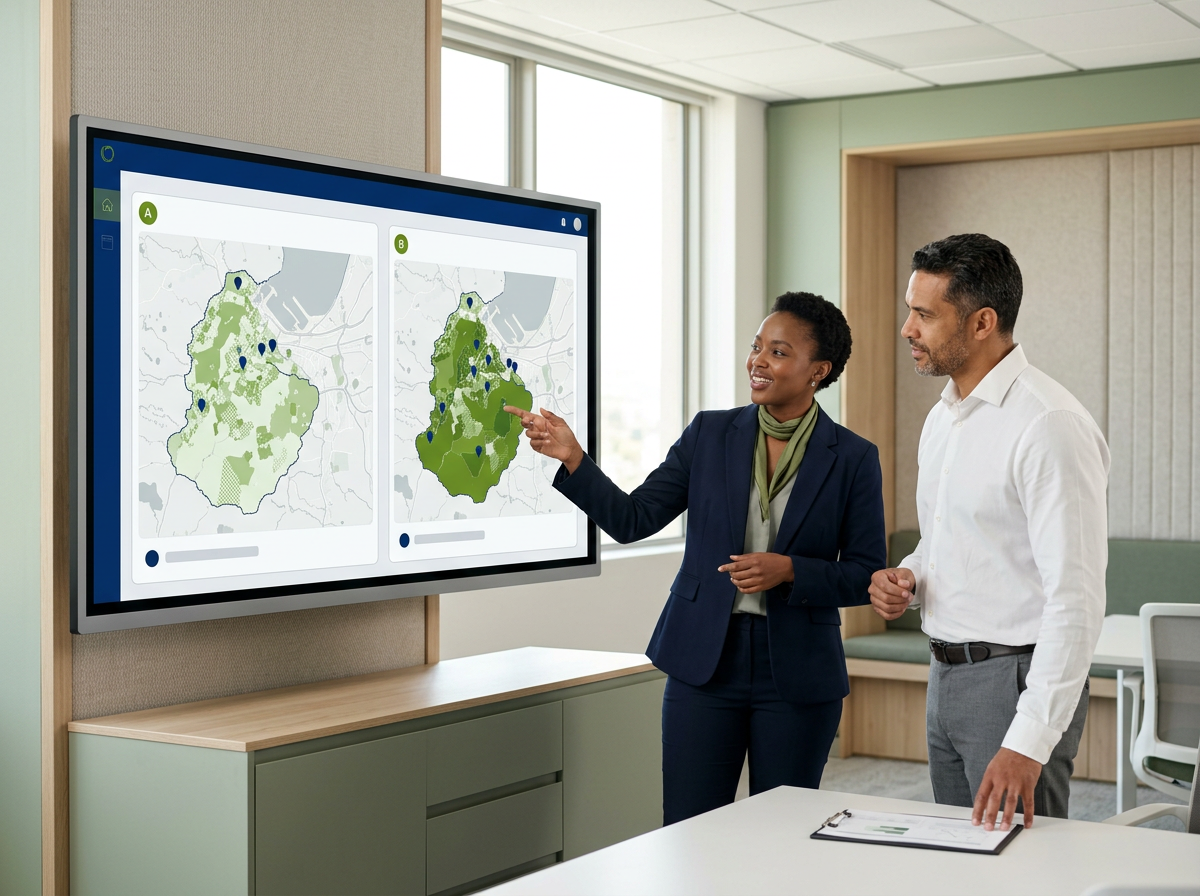
Show two side-by-side South African catchment maps with similar total-population labels but visibly different demographic patterns. Map A should show a younger, lower-income mix spread across the catchment; Map B should show a more concentrated working-age, mid-income market. Add a small neutral panel under each map titled "What the total does not show". Avoid implying that either profile is universally better and do not use fabricated percentages.
See how the market changes across the map
Demographic tables summarise an area, but maps reveal distribution. The target market may be concentrated on one side of a proposed site, separated by a major road, or clustered around a different retail destination. This spatial pattern can affect the catchment definition, the site entrance that matters and even which alternative should be compared.
LEO, Lightstone Explore Online, brings demographic and location data into an interactive geospatial platform. Teams can select a radius or custom polygon, examine indicators around a location and compare the result with existing stores or other opportunities. Lightstone’s demographic and location data is updated annually and can be explored across more than 100,000 enumerated areas, providing a granular South African view.
LEO also includes 19 lifestyle segments. Segmentation can add a useful customer lens, but it should be treated as an input rather than a verdict. A segment profile becomes more meaningful when it is connected to the retailer’s observed customer and store-performance data.
Choose indicators that relate to the retail question
More data does not necessarily produce a clearer answer. The right demographic view depends on the business model.
A value-led grocery concept may need to understand household size, income bands and residential density. A specialist service may place greater weight on age, employment and lifestyle fit. A convenience format may need demographic insight combined with movement, access and daytime activity. The relevant market for a destination store may extend beyond a simple radius.
Before analysing a site, define the customer hypothesis: who the concept is designed to serve and which observable indicators provide a reasonable way to locate that market. Then apply the same measures to every candidate. This keeps the analysis focused and reduces the temptation to select whichever statistic makes a preferred property look attractive.
Demographic data should also be interpreted at an appropriate geographic scale. A wide area can smooth away important local differences; a very narrow boundary can exclude people who realistically use the location. What is catchment analysis? explains how the chosen area shapes the answer.
“Demographic data is most useful when it sharpens the customer question, not when it is used as a substitute for understanding the customer.”
A data-led team asks whether the selected indicators reflect real behaviour, then checks the conclusion against operational knowledge, field observations and internal evidence.
Put the demographic profile in commercial context
People do not experience a market as a spreadsheet. They travel through it, encounter competing offers and choose between retail destinations. Demographics should therefore be considered alongside the existing store network, nearby shopping centres, competitors, complementary retailers, access and the shape of the catchment.
This combined view can reveal useful distinctions. A market may fit the target customer but already be well served. Another may have fewer target households but limited competition and strong alignment with an existing travel route. Demographic evidence narrows the opportunity; retail and location context helps determine whether the site can serve it.
For stakeholder discussions, the LEO Market Report turns a selected radius or polygon into a structured output in minutes. It combines an area map with population, household-income, age and employment insight, as well as nearby retail and shopping-centre context. That makes it easier to compare markets on a consistent basis and explain what the local profile means for the decision.
For the growth implications of this analysis, read How demographic insight supports retail growth.
Key takeaways
- Separate total population from the portion of the market that fits the offer.
- Select demographic indicators that relate directly to the concept and customer.
- Map distribution; an area average can conceal important local patterns.
- Use a realistic catchment boundary and compare locations consistently.
- Read demographics alongside access, competition and the surrounding retail landscape.
- Use LEO to explore and the Market Report to communicate the selected market clearly.

Understand the people behind your next location
Use LEO to explore annually updated South African demographic and location data around a site, then create a business-ready Market Report for the chosen radius or polygon. Talk to the Lightstone Explore team to discuss customer-fit analysis, site comparisons or network planning for your business.
Better demographic questions lead to better location conversations
Demographic data helps retailers look beyond the pin and understand the market a location is expected to serve. Its role is not to label an area as good or bad. It is to reveal customer fit, expose differences between options and give the team a clearer basis for further investigation.
When demographic insight is mapped at the right scale, connected to retail context and translated into a consistent report, a location recommendation becomes more relevant, transparent and useful to the business.