
What is a gap in a retail network?
A map of existing stores may reveal broad areas without coverage, but an empty space on a map is not automatically a viable growth market. The area may have too few target customers, limited spending power, poor accessibility or strong competition. In other cases, an apparently well-covered market may still contain overlooked pockets of demand.
Finding meaningful network gaps requires more than plotting store locations. Retailers need to understand the people, commercial activity, competition and movement patterns surrounding each location.
This is where location intelligence changes the conversation. It turns a general ambition to grow into a structured, evidence-based plan that helps decision-makers identify, compare and prioritise opportunities before competitors move into them.
A retail network gap is an area where a business has limited or no effective coverage despite there being potential demand for its products or services.
These gaps are sometimes referred to as white-space opportunities. They may exist between current stores, beyond the boundaries of an established footprint or within markets where the retailer has a presence but is not serving customers effectively.
A network gap could be:
A growing residential area with no nearby store
A customer segment that is not adequately served
A town or suburb where competitors are present but your brand is not
An area positioned outside the effective catchments of your current stores
A market where customer demand has grown since your network was last reviewed
A location where a smaller or different store format could succeed
The strongest opportunities are not always the largest blank spaces on the map. They are the areas where unmet demand, customer fit, accessibility and commercial potential intersect.
Why network gaps are difficult to identify
Retail networks develop over time. Stores may have been opened under different economic conditions, based on earlier population patterns or in response to property opportunities that happened to become available. As the market changes, the network may no longer align perfectly with where customers live, work and shop.
Several factors make gaps difficult to see.
Existing stores can create a false sense of coverage
Two stores may appear to cover an entire region, but their real catchments may be smaller or shaped differently than expected. Travel barriers, road access, competing shopping centres and customer behaviour can all affect how far a store’s influence extends.
Population size does not equal customer potential
A densely populated area may look attractive until the retailer examines household income, lifestyle, age, employment and customer fit. A less populated area may, in contrast, contain a stronger concentration of the brand’s target market.
Markets change faster than store networks
Residential developments, new transport routes, shopping centres and economic activity can change the potential of an area. A location dismissed several years ago may now be a meaningful expansion opportunity.
Competitor activity can shift demand
A competitor opening nearby may indicate market potential, but it may also change shopping behaviour and increase the urgency of evaluating that area. Waiting until the competitor is established can make it more difficult to secure the strongest site.
Internal data is often viewed separately
Store performance, customer information, competitor locations, demographic data and development information may sit in different systems. When these datasets are analysed separately, important geographic patterns can remain hidden.

Start with a clear view of your existing footprint
Before looking for new locations, retailers need an accurate view of the network they already have.
Plot every existing store, branch or outlet on a map and assess the footprint as a connected network rather than as a collection of individual sites.
Consider:
Where stores are concentrated
Which areas have limited coverage
Where store catchments overlap
Which stores serve unusually large areas
Which markets sit beyond the effective reach of the current network
Whether the current footprint still reflects the target customer base
See the full potential of your network
This first step can reveal obvious gaps, but it can also highlight another risk: cannibalisation. A network with many locations is not necessarily a strong network if nearby stores are competing for the same customers.
The aim is not simply to increase the number of stores. It is to create a footprint in which each location has a clear role and contributes to the strength of the network as a whole.
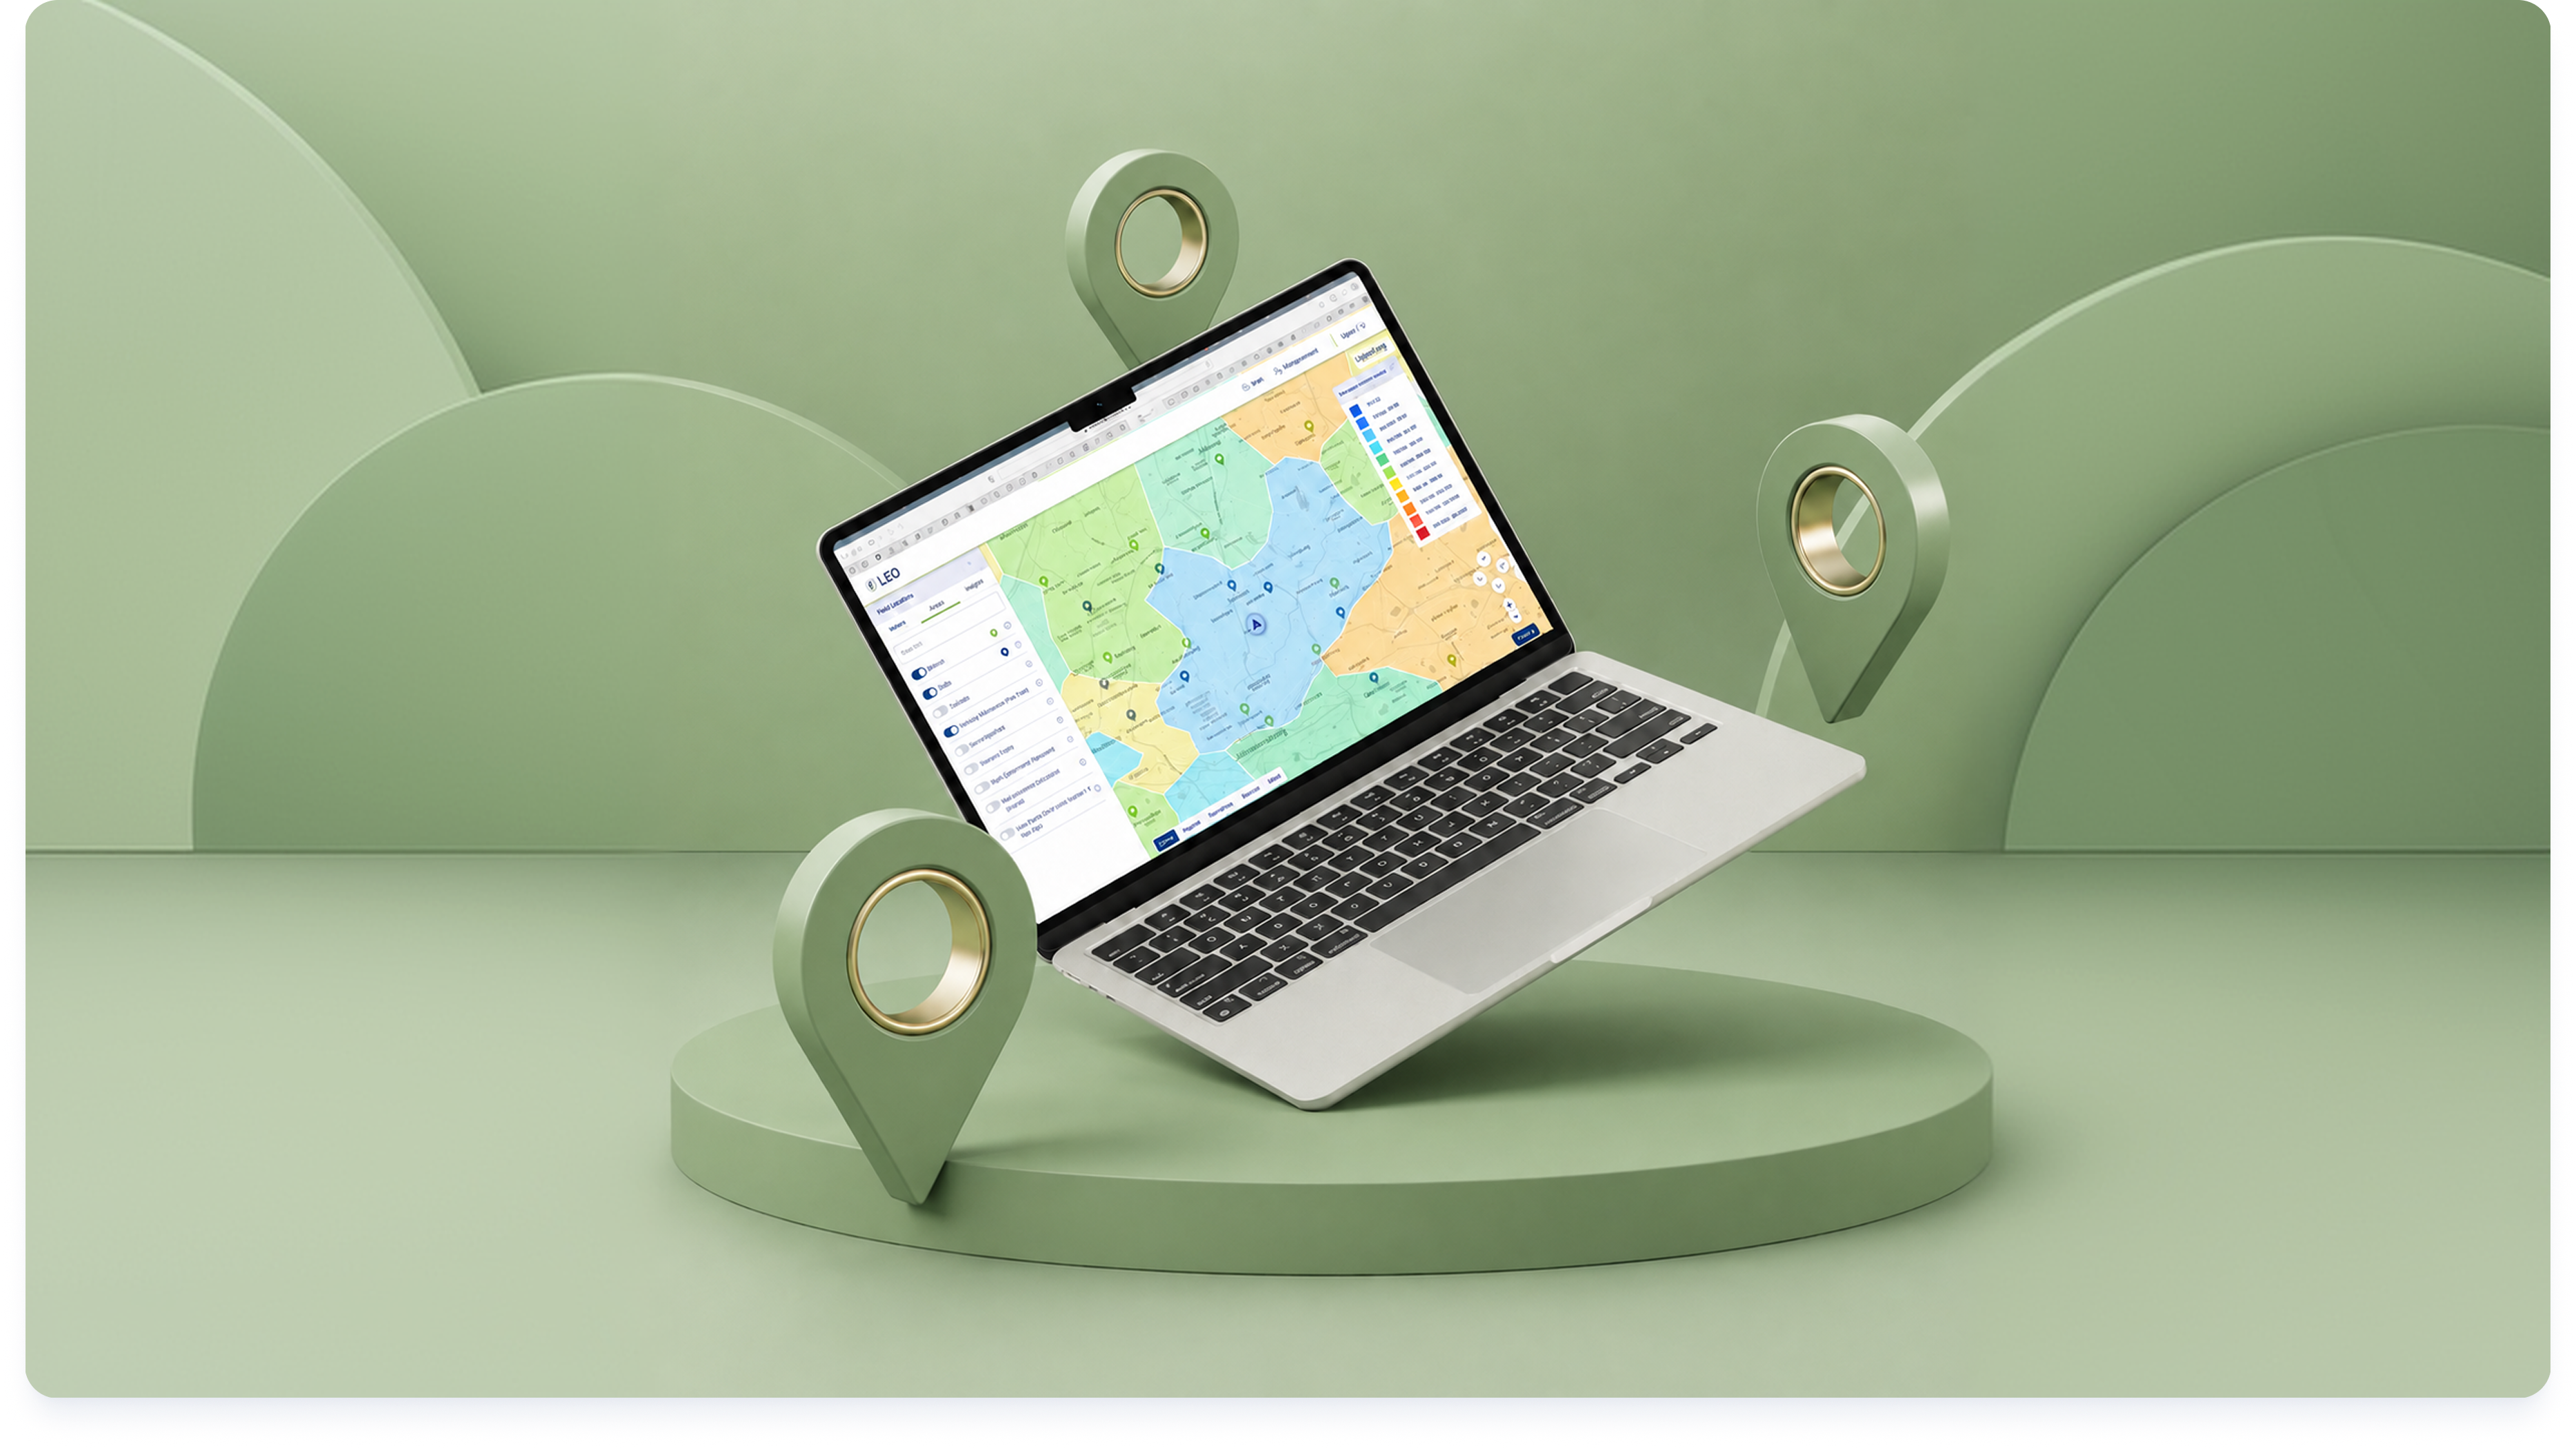
LEO supports this broader view by helping teams review their network against the surrounding South African retail landscape, identify possible gaps and overlap, and build a clearer foundation for long-term network planning.
Define the customers you are trying to reach
A network gap is only valuable when it contains enough of the right customers.
Retailers should therefore define the characteristics of a strong market for their particular brand. These characteristics will differ across categories and store formats, but may include:
Household income
Age profile
Household composition
Employment patterns
Lifestyle or consumer segment
Residential density
Daytime population
Existing shopping behaviour
Proximity to complementary businesses
Accessibility and travel patterns
This creates a customer profile that can be applied consistently
across different areas
“Where are there enough customers
who resemble the customers supporting our successful stores?”
This is a much more useful question because it links expansion planning
to demonstrated market fit
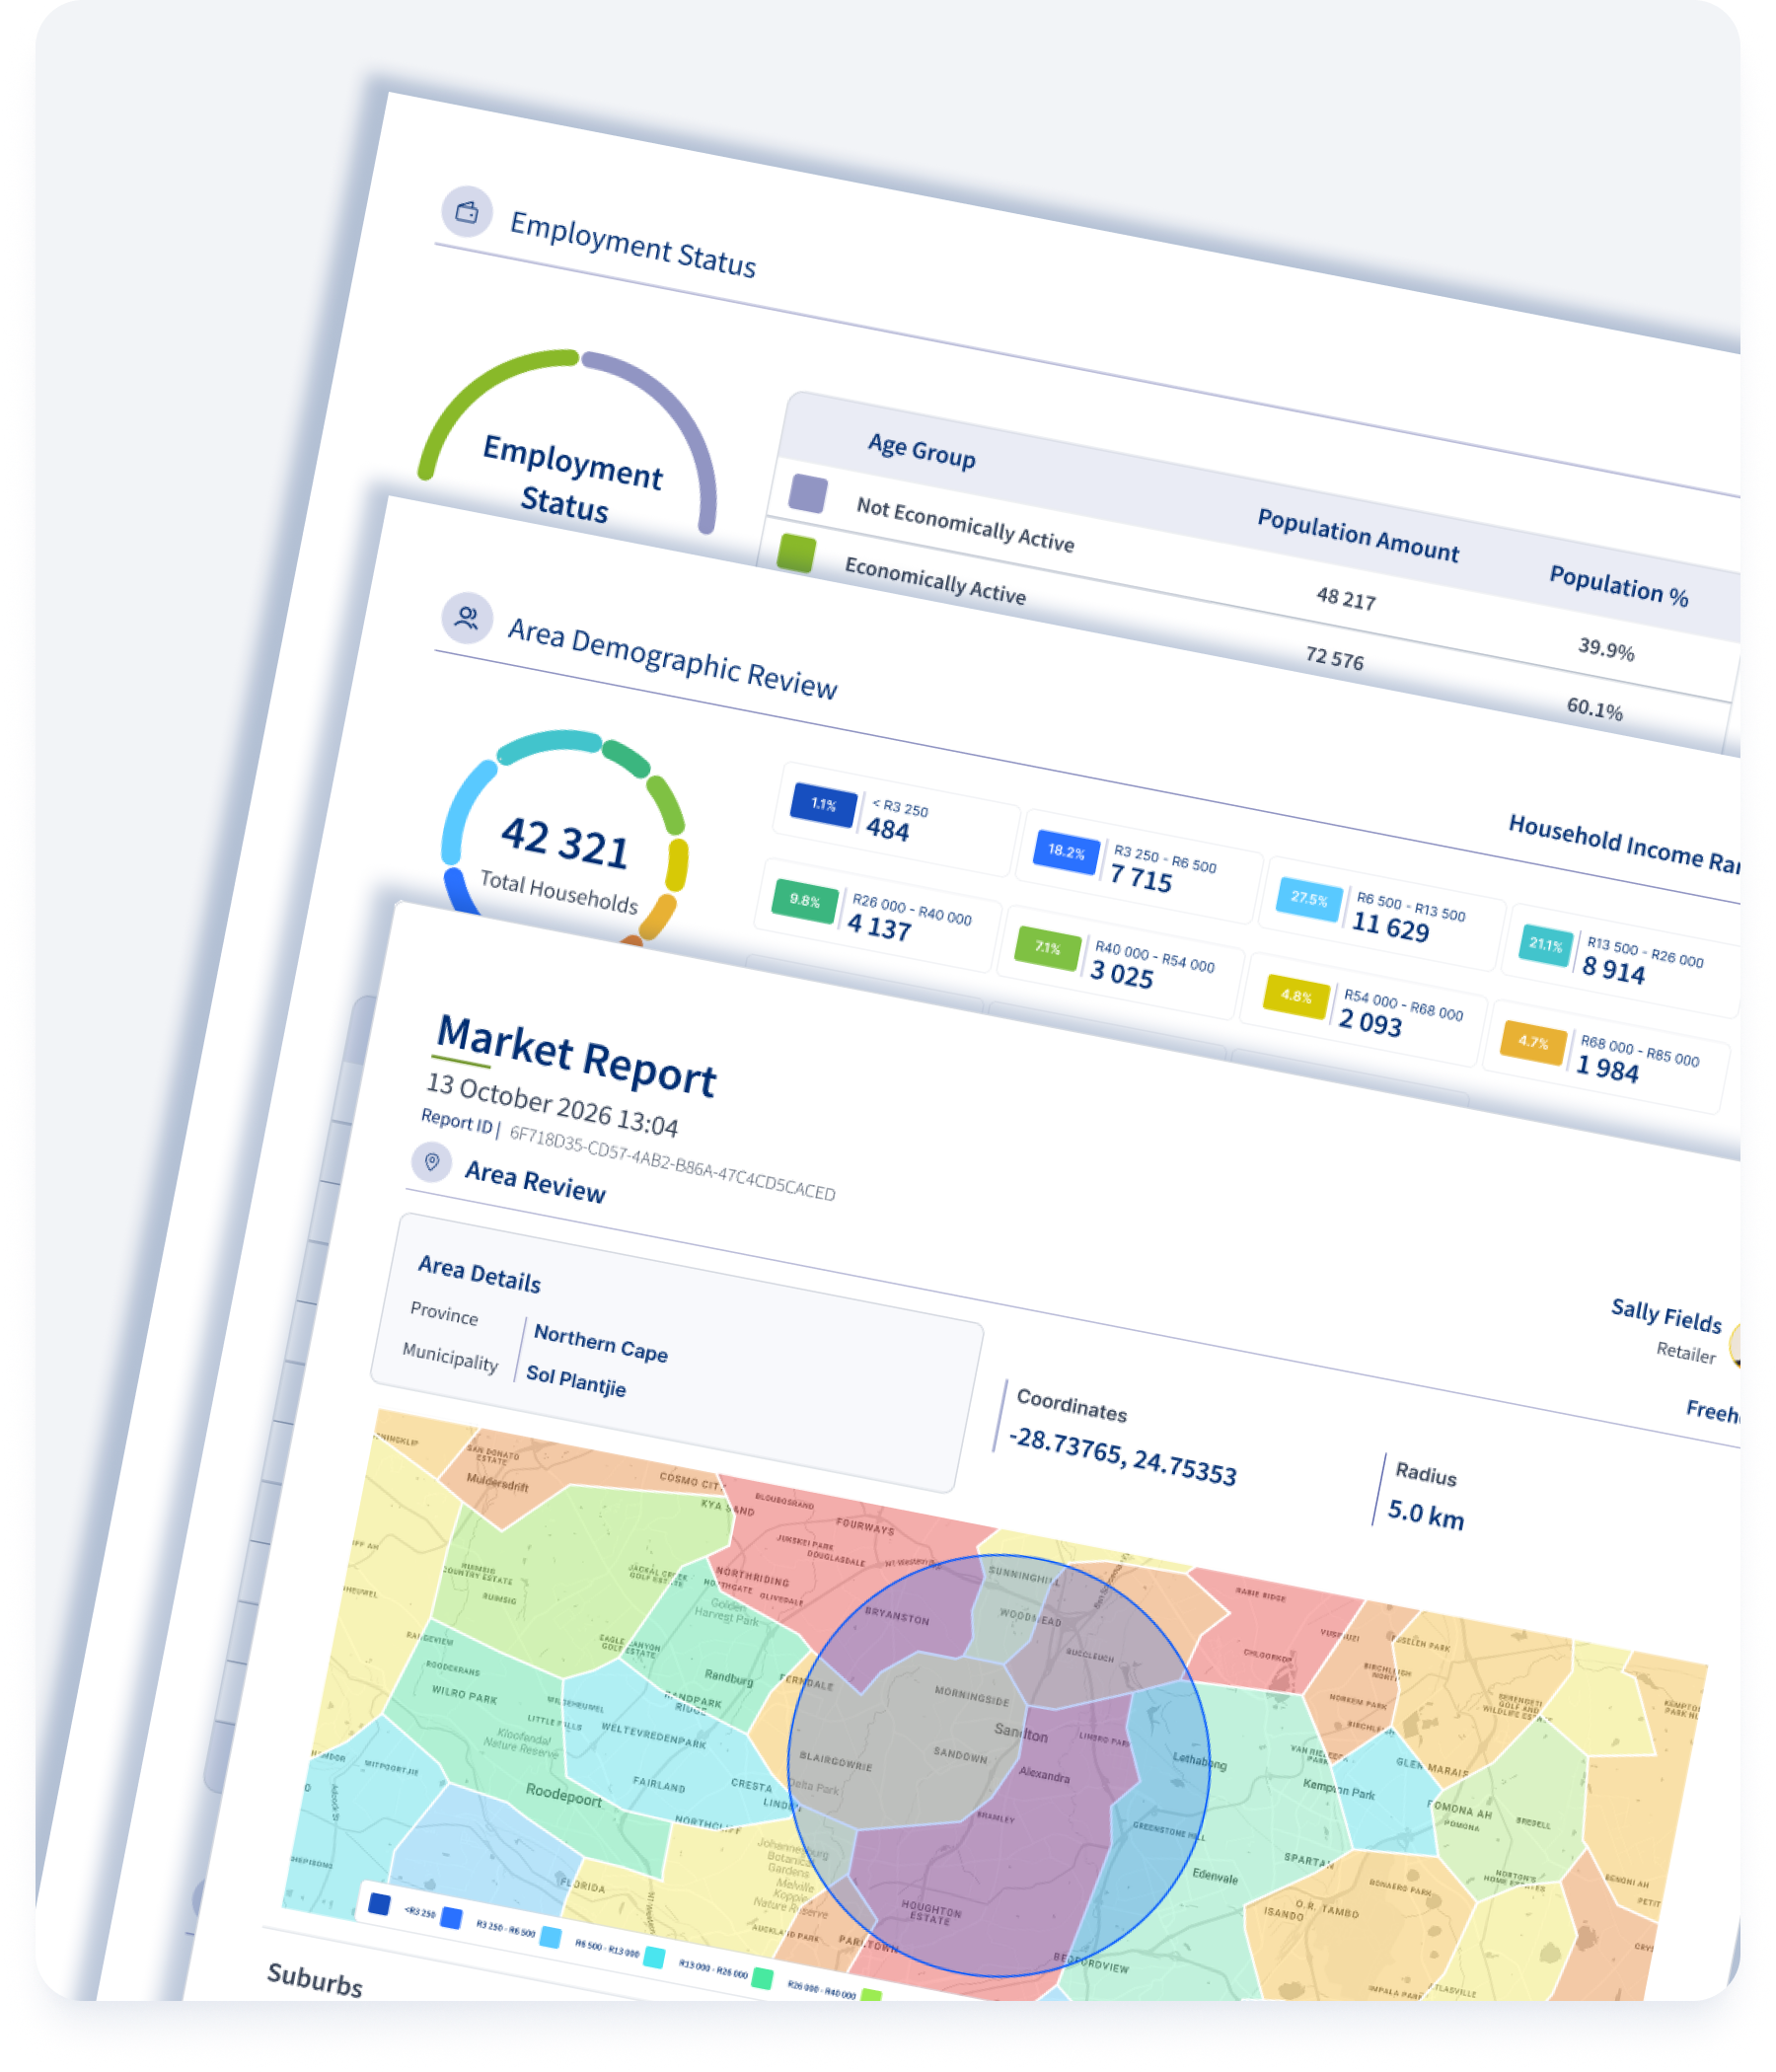
LEO combines demographic and location insight to help teams examine income, age, employment and lifestyle-driven market characteristics around a location. Its Market Report can structure this information for a defined radius or polygon, helping teams assess whether an area aligns with their target customers
Analyse the real catchment of each store
A catchment is the geographic area from which a location is likely to attract customers.
Simple distance circles can provide a starting point, but real catchments are rarely perfectly round. They are influenced by:
Road networks
Drive time
Physical barriers
Public transport
Shopping centre destinations
Competitor locations
Customer preferences
The strength and format of the store
Understanding these catchments, helps retailers distinguish between areas that are genuinely underserved and areas that are already being served by an existing location
For example, an area may sit 10 kilometres from the nearest store but remain poorly served because a highway, travel pattern or competing retail destination separates customers from that location. Another area may be much further away but still fall naturally within the store’s trade area.
Using catchment analysis, retailers can begin to see:
Areas outside the effective reach of current stores
Markets served by only one distant location
Overlap between neighbouring stores
Locations that may be carrying more demand than expected
Opportunities for a new format or relocation
LEO allows teams to define catchments using a radius or custom polygon, query the underlying data and generate a standardised Market Report for the selected areas. This brings demographic and nearby retail context into the same review
Look beyond population and assess commercial depth
Population is important, but it is only one part of market potential
A meaningful network-gap analysis should consider whether an area has enough
commercial depth to support the proposed location over time
This includes questions such as:
Is the population large enough?
Is the target customer sufficiently concentrated?
Does the area have the appropriate income profile?
Is the population stable, declining or growing?
Are there complementary retailers nearby?
Is the area already functioning as a retail destination?
What types of stores and shopping centres are present?
Are new residential or commercial developments changing the market?
Would the proposed store add new coverage or mainly redistribute existing sales?
This prevents retailers from treating all uncovered areas as equal. Several areas may appear to be gaps, but only some will have the customer base and retail context needed to support investment.
Map your competitors, but do not copy their network
Competitor locations provide valuable market signals. Their presence may indicate that an area has sufficient demand, while their absence could point to either an untapped opportunity or a weak market. The goal is not to open wherever competitors have opened. It is to understand what their footprint reveals
Review:
Where competitors are concentrated
Which areas they have entered recently
Where no major competitor has a presence
Which customer markets they appear to prioritise for
Whether a competitor’s location leaves nearby areas underserved
Where your brand could offer a stronger or more convenient and valuable proposition
Competitor mapping becomes especially useful when combined with demographic and catchment information
An area with no competitor may appear promising, but the demographic data could reveal limited market fit. Alternatively, a competitor-dense area may still contain enough demand for another store, particularly when the market is growing or your brand serves a different customer segment. The competitive layer should therefore be treated as one input in the decision, not as the decision itself.
Compare potential gaps with your strongest existing stores
Your current network contains valuable evidence about what works
Analyse successful locations and identify the shared conditions behind their performance
These may include:
Similar demographic profiles
Comparable household income
Particular retail environments
Access to major roads
Specific population thresholds
Strong complementary retail
Limited direct competition
Certain catchment sizes or shapes
These characteristics can be used to create a benchmark for evaluating new areas
A potential gap does not need to replicate an existing store exactly. However, comparing it with proven locations gives decision-makers a more defensible basis for estimating market fit. It can also reveal different types of growth opportunity. One area may support a full-format store, while another may be better suited to a smaller branch, convenience format, collection point or service location.
Rank opportunities instead of relying on one “perfect” location
A network study should produce a prioritised pipeline of opportunities rather than a single answer. Retailers can create a scoring framework that evaluates each possible gap against consistent criteria. Consider the following:
Questions to consider
Customer fit Does the area contain enough of the target customer?
Market size Is there sufficient demand to support the location?
Existing coverage Is the market already served by another store?
Competition How established are competitors in the area?
Accessibility Can customers reach the proposed location easily?
Retail context Does the surrounding environment support the format?
Growth outlook Is the market likely to strengthen over time?
Cannibalisation risk Could the new store weaken existing locations?
Site availability Are appropriate properties or centres available?
Strategic fit Does the opportunity support the broader network plan?
The result could classify opportunities as:
Priority opportunities:
Strong market fit and limited coverage
Emerging opportunities:
Promising areas that should be monitored
Conditional opportunities:
Potentially viable, depending on site or format
Low-priority areas:
Insufficient demand or significant overlap risk
This gives property and expansion teams a clear direction while allowing leadership to understand why certain markets have been prioritised.
Network opportunity → market evaluation → catchment analysis → site assessment → commercial decision
Validate the gap at site level
Network analysis identifies promising markets.
It does not automatically identify the right property. Once an area has been prioritised, the retailer still needs to assess individual sites based on:
Visibility
Access and egress
Parking
Foot traffic
Vehicle traffic
Centre performance
Tenant mix
Rental terms
Store configuration
Local development plans
Proximity to direct competitors
A strong market can still produce a weak store if the site itself is poorly positioned
Similarly, a highly attractive property cannot compensate indefinitely for a market that lacks sufficient customer demand.
The most reliable process therefore moves from:
Location intelligence strengthens the early stages of this process, helping teams focus their site searches and field investigations on the areas with the strongest evidence behind them.
Turn analysis into a decision-ready business case
Identifying a gap is only useful when the opportunity can be clearly communicated to decision-makers.
Senior stakeholders, property committees and finance teams may need to understand:
Why this area has been prioritised
Who the target customer is
How large the potential market may be
How the opportunity compares with other areas
What competitors are doing
Whether an existing store could be affected
Which assumptions still need to be tested
Why the timing matters
A structured Market Report can help turn layered location data into a presentable view of the area, including demographic, income, employment and surrounding retail information. LEO’s Market Report is designed to support site recommendations, lease negotiations and stakeholder discussions by packaging these indicators into a consistent output.
This is important because the final recommendation must do more than show that an area is empty. It must explain why the gap represents a credible business opportunity.
Retail growth opportunities rarely remain uncontested forever
When competitors identify an attractive market first, they may secure:
The strongest available property
Better lease terms
Early customer loyalty
Greater local brand recognition
Preferred positions in new developments
Valuable information about market performance
Being first does not guarantee success, but recognising an opportunity early gives a retailer more options.
A continuous network-planning process is therefore more valuable than a once-off expansion study. Retailers should regularly review how their footprint compares with changes in demographics, competition, development and customer movement
The question should not only be:
“Where should we open next?”
It should also be:
“What is changing in our market, and which opportunities could become strategically important before our competitors recognise them?”
How LEO supports retail network-gap analysis
LEO is Lightstone’s location intelligence and GIS platform for teams that need to understand markets, assess locations and plan growth with greater confidence.
It brings together map-based analysis, retail landscape information, demographic context, catchment analysis and reporting so that retailers can evaluate both their existing footprint and future opportunities in one broader location view.
Teams can use LEO to:
Map and review an existing store network
Examine gaps and potential overlap
Analyse catchments and trade areas
Compare possible growth markets
Explore demographic and lifestyle characteristics
Review nearby malls, stores and retail activity
Combine internal business data with location-based datasets
Generate Market Reports for defined areas
Build clearer recommendations for internal stakeholders
How LEO supports retail network-gap analysis
LEO is built on South African retail and demographic datasets, including a mapped landscape of more than 1,900 malls and 60,000 stores, 19 demographic lifestyle segments and over 100,000 enumerated areas.
By bringing this information together, LEO helps retailers move beyond visible blank spaces and identify the gaps that have meaningful commercial potential.
From a gut feeling to a defensible growth plan
Most experienced retail teams already have a sense of where opportunity may exist. Their knowledge of customers, competitors and property markets remains an essential part of the process.
Location intelligence does not replace that experience. It gives teams a way to test it.
The result is a clearer growth plan based on:
Where current stores are—and are not—providing effective coverage
Where the target customer is concentrated
Which markets have sufficient commercial depth
Where competitor activity is creating opportunity or urgency
Which gaps can support the right store format
Which opportunities deserve immediate attention
Retailers that can answer these questions consistently are better positioned to act while others are still relying on assumptions.
Explore your footprint with Lightstone LEO
Your next growth opportunity may already be visible in the data.
Lightstone LEO helps retail, property and planning teams assess their current footprint, identify potential network gaps and compare areas using credible South African market insight.
Explore LEO’s retail and network-planning solutions or talk to the Lightstone team about the location challenges affecting your network.
Frequently asked questions
What is retail network optimisation?
Retail network optimisation is the process of improving the coverage, performance and long-term structure of a store network. It involves assessing existing locations, identifying gaps or overlap, evaluating relocation opportunities and determining where future stores could add the greatest value.
How do retailers identify white space in a store network?
Retailers identify white space by mapping existing stores and their catchments, then comparing coverage with demographic demand, competitor presence, retail activity and customer movement. An uncovered area becomes a meaningful opportunity only when there is evidence that the market can support the proposed store.
What data is needed to find retail network gaps?
Useful data may include store locations, performance data, customer information, demographic profiles, household income, competitor locations, catchment areas, road access, shopping centres, surrounding retail and planned developments.
Does an area without a store automatically represent an opportunity?
No. A blank area on a map may have insufficient demand, poor customer fit, weak accessibility or limited commercial activity. Retailers need to evaluate the underlying market before treating it as a genuine network gap.
How can demographic data improve expansion planning?
Demographic data helps retailers understand who lives in an area and whether those consumers align with the brand’s target market. Income, age, employment, household and lifestyle information can help teams distinguish between areas with general population growth and those with commercially relevant demand.
Can LEO help identify overlap between existing stores?
Yes. LEO supports network planning by helping teams review their broader footprint, analyse catchments and assess where stores may be covering the same market. This can help identify possible cannibalisation as well as underserved areas.
How often should retailers review their store network?
Retailers should review their networks regularly and whenever significant market changes occur. These may include new competitors, residential developments, changing demographics, new shopping centres, transport changes or shifts in store performance.