

Move from total population to relevant demand
A large population does not automatically create a strong retail opportunity. The more useful question is whether the area contains enough people whose needs and circumstances fit the proposition.
Population size and density provide a base view. Household income ranges help assess affordability. Age and household composition suggest life-stage needs. Employment adds economic context, while lifestyle segmentation can help teams see how several characteristics combine across the market.
These measures should not be used to label individuals or assume that every household behaves in the same way. They describe broad market patterns. Their role is to test the commercial hypothesis: does this offer, format and price position make sense for this area?
For a site-level checklist, read What Demographic Data Should You Review Before Choosing a Site?
Use the strongest stores as learning markets
Retailers can learn from the demographic context around stores that already perform well. The goal is not to copy one successful location blindly. It is to identify recurring market characteristics and understand how they interact with access, retail destination, competition and store format.
Ask:
- Which customer profiles are consistently present around strong stores?
- Do different formats succeed in different types of market?
- Where does performance appear stronger or weaker than the demographic potential suggests?
- Which areas elsewhere in the country show a similar customer profile but limited network coverage?
This comparison can uncover markets worth investigating and existing sites that need a closer review. It also helps the business distinguish a demographic opportunity from a property opportunity: both matter, but they are not the same thing.
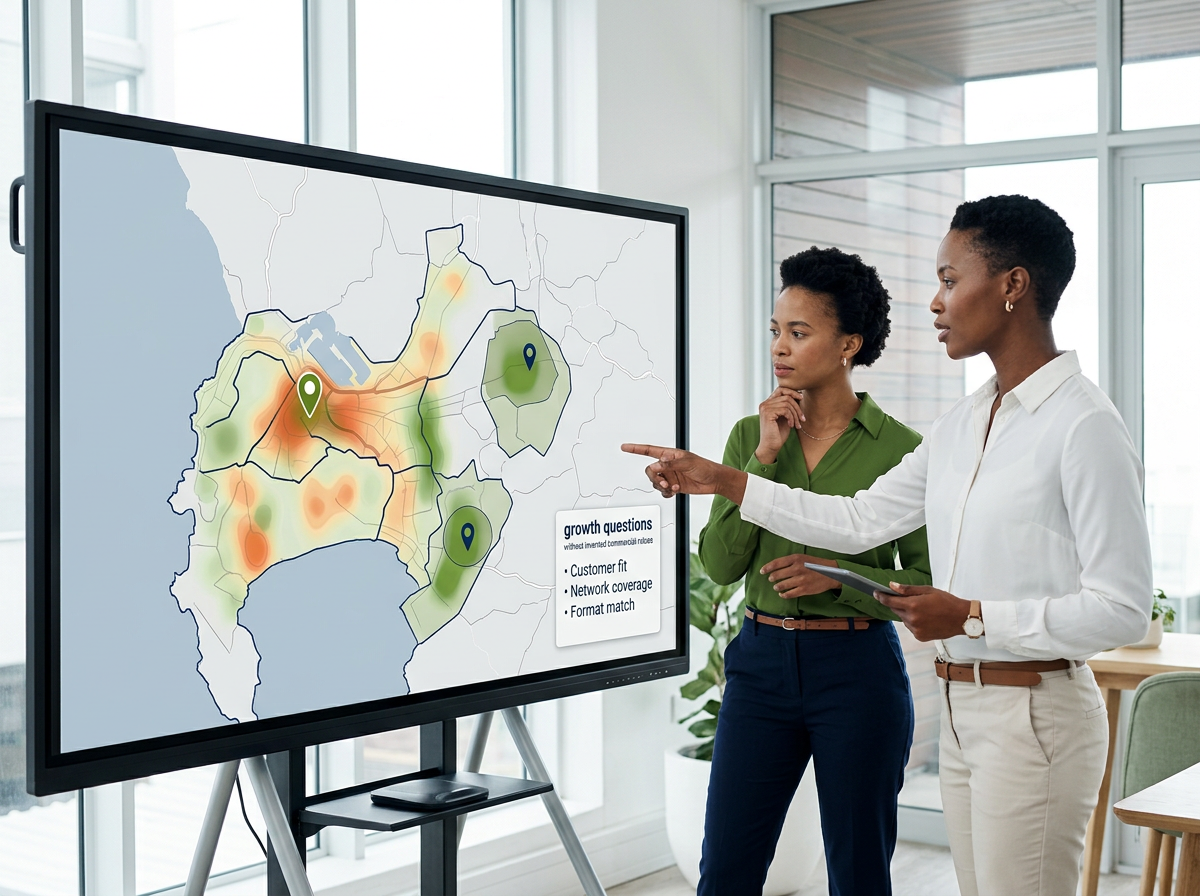
Create a strategic growth map of a fictional South African metro in a LEO-inspired style. Show target-customer concentration as a graded heat layer, existing store catchments, one strong-store benchmark marker and two possible growth zones. Add a small “growth questions” panel for Customer fit, Network coverage and Format match, without invented commercial values.
See where target customers and network coverage intersect
LEO, Lightstone’s interactive geospatial platform, places demographic and lifestyle patterns on a map alongside the retail landscape and a business’s own locations. Teams can explore where relevant customers are concentrated, where current stores provide coverage and where potential gaps may exist.
Lightstone’s South African data foundation includes more than 100,000 enumerated areas and 19 Kaleidoscope lifestyle segments. Demographic and location data is updated annually, helping teams review the network against a current and granular market view.
Demographic insight is most powerful when it helps a retailer understand not only where more people live, but where the proposition is more likely to be relevant.
Apply demographic insight across the growth cycle
Demographics can strengthen several connected retail decisions:
- Market prioritisation: Screen towns, suburbs or development corridors for relevant customer concentrations.
- Site selection: Assess the people within a proposed catchment alongside access, competition and retail context.
- Format planning: Consider whether the local market supports the intended store size, assortment or shopping mission.
- Network optimisation: Identify under-served customer groups, possible coverage gaps and areas of overlap.
- Store review: Compare the market opportunity with actual performance to investigate whether location, execution or another factor may be driving the result.
- Stakeholder alignment: Give property, strategy, operations and leadership teams a shared view of the market behind the recommendation.
The pillar article How to Identify Gaps in Your Retail Network Before Your Competitors Do explains how these layers support white-space analysis. How to Evaluate Whether Your Current Store Is in the Right Place applies them to an existing location.
Turn the demographic story into a business-ready output
Analysts need room to explore. Decision-makers need the important findings in a consistent form. LEO supports the first need by allowing users to examine areas, adjust the geographic view and compare demographic patterns with stores, malls and other market context.
The LEO Market Report supports the second. Generated in minutes for a chosen radius or polygon, it combines an area map with population and demographic insight, household income, age, employment and nearby retail visibility.
Use the report to present the local market clearly, while keeping the business interpretation specific. Explain which demographic characteristics matter to the offer, how the area compares with a benchmark and what non-demographic factors still need validation. This keeps the recommendation evidence-led without suggesting that people data alone can forecast performance.
For longer-term network thinking, read How South African Retailers Are Using Data to Future-Proof Their Store Networks.
What demographic insight contributes to growth
- It helps define relevant demand rather than relying on population totals alone.
- It can reveal market patterns around successful and underperforming stores.
- It supports expansion, format, network and existing-store decisions.
- Granular, current data helps teams see important variation within broad areas.
- Demographics should be interpreted with access, competition, retail context and business performance.
- LEO enables exploration, while the Market Report helps stakeholders review the market consistently.

Connect your growth plan to the South African market
Explore demographic, lifestyle and retail patterns in LEO, create a business-ready Market Report for a target area, or contact Lightstone Explore to discuss how your team can apply location insight to network growth.
Grow with a clearer view of the people behind each place
Demographic insight gives retail growth a customer-centred foundation. It helps teams understand where the proposition fits, where the network may be missing relevant demand and where a different format or closer investigation may be required. Combined with spatial, retail and commercial context, the insight supports choices that are easier to compare, explain and revisit as the market changes.